Squeeze + Momentum Oscillator
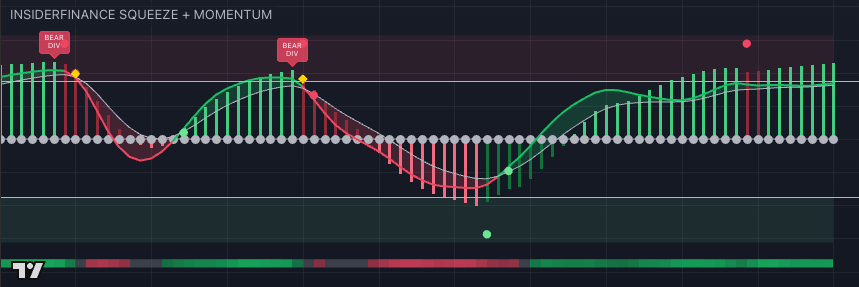
Squeeze + Momentum is the lower-pane read for the InsiderFinance technical analysis system.
The Algo tells you what is happening in chart structure.
Squeeze + Momentum helps you understand the pressure, energy, volume participation, divergence, and consensus underneath that move.
This is the section where functionality matters most.
The oscillator is not one line. It combines multiple tools into one lower-pane workflow so traders do not have to stitch volatility, momentum, divergence, volume, and market-breadth style confirmation together manually.
View modes and the guide table
You can view Squeeze, Momentum, or Both from the settings.
You can also turn on Show Guide Table to overlay a quick legend directly on your chart.
The settings menu includes tooltips for each major feature, so if you are unsure what a toggle does, hover the info icon and read the built-in explanation.
That matters because the tool is designed to be used hands-on.
The course explains the workflow, and the script itself gives you an in-chart reference while you practice.
Squeeze: pressure and release
The Squeeze side helps you identify compression and release:
- Center dots show whether a squeeze is on or released:
- Orange dots indicate compression.
- Gray dots indicate release.
- The histogram shows the pressure and directional read.
- Zone-based circles appear when squeeze behavior shifts in the overbought or oversold regions, helping you notice higher-conviction breakout or reversal-review moments instead of ordinary noise.
Think of this as the pressure gauge:
- A chart that is compressing can be building energy before a larger move.
- A chart that is releasing can be moving out of that compression.
The goal is not to guess direction from one dot.
The goal is to know when pressure is present and whether the rest of the InsiderFinance system supports the setup.
Momentum: energy and crossovers
The Momentum side uses an SMI-style momentum read with a signal line.
Crossover circles appear when the momentum line crosses its signal line.
Those circles help you see when energy is shifting, especially when they happen in meaningful zones rather than in the middle of noise.
This is where traders often get better context than price alone:
- Price can still be rising while momentum is fading.
- Price can still be falling while momentum is improving.
Momentum helps you decide whether the move has energy behind it or whether the chart is starting to weaken.
Divergence: price and momentum disagreement
Divergence labels automatically plot when price and momentum disagree.
A BULL DIV label can appear when price makes a lower low while the oscillator makes a higher low below the zero area.
A BEAR DIV label can appear when price makes a higher high while the oscillator makes a lower high above the zero area.
That is important because divergence often tells you to slow down and inspect the setup.
It can signal that the current move is losing force even before the price chart fully turns.
Consensus Ribbon, High Vol Diamonds, and Accumulation Diamonds
The Consensus Ribbon at the bottom aggregates RSI, CCI, and MFI into a heatmap-style read:
- Green shows bullish consensus.
- Red shows bearish consensus.
- Gray shows neutral conditions.
Use it as a quick background check: does broader oscillator consensus support the setup or conflict with it?
Gold High Vol Diamonds appear when relative volume is significantly elevated, above 1.5x the recent average, and a signal is present.
They tell you participation is stronger than normal.
Purple Accumulation Diamonds appear when price is squeezing while OBV is rising, suggesting pressure is building while volume behavior improves beneath a flatter price move.
These features help answer the question a trader actually cares about: is this move supported by participation and accumulation, or is it just a weak signal in isolation?
How to pair it with the Algo
Use the Algo for structure first: Buy/Sell labels, Confirm Line, HTF Panel, support/resistance, Sniper Crosses, and SL/TP levels.
Then use Squeeze + Momentum to judge the quality of the move underneath the chart:
- Is pressure building or releasing?
- Is momentum crossing in the same direction as the setup?
- Is divergence warning you to slow down?
- Does the Consensus Ribbon agree?
- Are High Vol or Accumulation Diamonds adding participation context?
When the chart overlay and lower pane agree, the setup is much easier to review.
When they conflict, the tool has still done its job: it helped you avoid over-trusting one signal.
Your next step
Open Squeeze + Momentum under the Algo and turn on the Guide Table.
Find one chart where the Algo signal, Confirm Line, HTF Panel, squeeze state, momentum crossover, and Consensus Ribbon all agree.
Then find one where they conflict.
That comparison is how the oscillator becomes useful instead of decorative.