Ticker: ATER
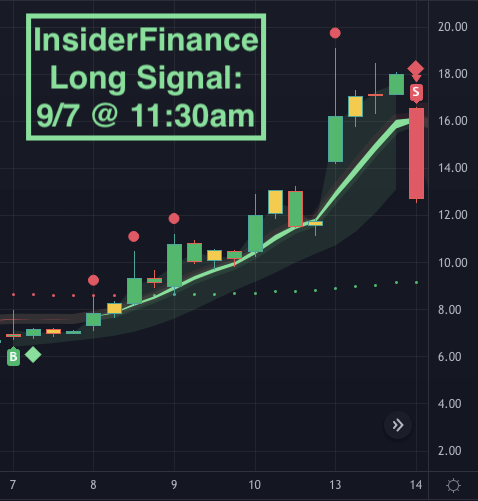
Use the ATER case study as a replay exercise for timing, confirmation, and risk structure.
The goal is to practice reading the chart from left to right.
You are not trying to judge the example after knowing everything that happened. You are practicing how a trader should think when a signal appears and the rest of the chart still has to be reviewed.
That is what makes historical examples useful. They let you slow the chart down and train the sequence.
Pause at the signal
Start at the visible marker cluster: the buy signal and swing diamond that appear close together.
Before moving forward, ask what the chart was actually offering at that moment:
- Did the close signal/diamond/buy sequence point to a cleaner setup, or did it still need confirmation?
- Was the signal supported by trend context?
- Was price near a support or resistance area that mattered?
- Did the Confirm Line help the setup or create conflict?
- Did the lower-pane read suggest pressure, momentum, or caution?
- Was there a clear level where the idea would weaken?
This is the same review you should run on a live chart. The case study simply gives you time to practice it without pressure.
Replay the setup in stages
Move through the ATER chart in three stages.
Stage 1: Attention. What made the chart worth inspecting?
Stage 2: Confirmation. Did the next layers support the signal, or did they require patience?
Stage 3: Risk and follow-through. Did the chart offer a clean structure, or did the setup become harder to explain as it developed?
That staged replay helps you avoid the biggest mistake in case studies: looking at the final move and assuming the decision was easy. The real value is learning how the chart looked at each step.
What InsiderFinance teaches through this example
ATER should reinforce the full course workflow:
- signals bring charts to your attention;
- confirmation decides whether the signal earns focus;
- Squeeze + Momentum helps judge pressure and energy;
- levels define whether the idea has structure;
- exit review watches whether the original reason remains intact.
When you can explain all of that in one historical example, the workflow becomes easier to repeat on current charts.
InsiderFinance makes that repetition easier because the key pieces stay visible inside TradingView.
The markers, confirmation context, lower-pane read, and risk-planning areas are part of the same review routine.
Your next step
Replay the ATER chart from left to right. Pause at the signal, name the supporting evidence, and write down what would have made the setup weaker.
Then use the same replay method on one current chart: attention trigger, confirmation, momentum, levels, and what would change your view.