Ticker: LVS
Use the LVS case study to practice separating signal recognition from setup quality.
This is one of the most important habits in the entire course. A visible label or marker can make a chart feel obvious.
But the signal is only the beginning of the review. The surrounding context decides whether the chart deserves more attention.
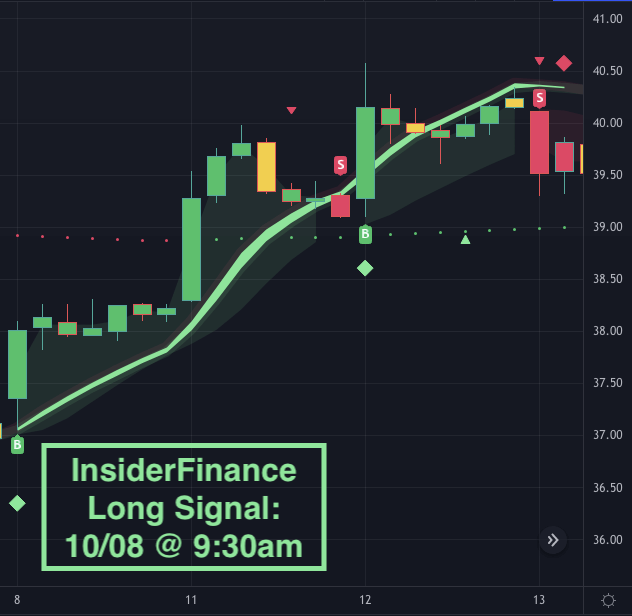
The LVS example gives you a clean way to practice that distinction because the chart shows a buy signal and a swing diamond.
Those cues can make the setup feel compelling quickly. The lesson is to challenge that first impression before treating the chart as clean.
Identify the signal, then challenge it
Start by naming the main attention trigger.
What did the chart show? In this case, start with the buy signal and swing diamond.
Then ask whether those cues are actually telling one clean story or simply creating a stronger reason to inspect the chart.
Once you identify the trigger, immediately challenge it with the rest of the workflow:
- Does the Confirm Line support the direction?
- Is the higher-timeframe panel aligned, mixed, or still developing?
- Is Squeeze + Momentum adding pressure, energy, or divergence?
- Are support/resistance and risk-planning levels giving the idea enough room?
- Is there a reason to wait for a cleaner setup?
That challenge is not hesitation. It is the discipline that makes the signal useful.
What the LVS replay should teach
The strongest lesson from a case study is not “the marker appeared and then the chart moved.”
The stronger lesson is learning how to explain the setup quality before focusing on the result.
If the signal had support from trend, confirmation, momentum, and structure, the chart was easier to review.
If one of those layers was missing, that missing layer becomes the training point. The goal is to learn what clean agreement looks like and what mixed evidence feels like.
That is why InsiderFinance is valuable in a case-study module. The system keeps the key review layers in one place, so the chart can become a practice rep instead of a story about one ticker.
Turn the example into a checklist rep
For LVS, write down three answers:
- Strongest confirmation layer: Which piece supported the setup the most?
- Weakest or missing layer: What needed more evidence?
- Risk structure: Did the chart offer a clean level for planning, or was the setup harder to frame?
That short exercise is how the case study becomes useful. You are training the same thinking you will need when a current chart sends an alert.
Your next step
Run the 4-Point Confirmation checklist on the historical LVS setup. Decide which point was strongest and which point needed more confirmation.