Take-Profit and Stop-Loss Levels
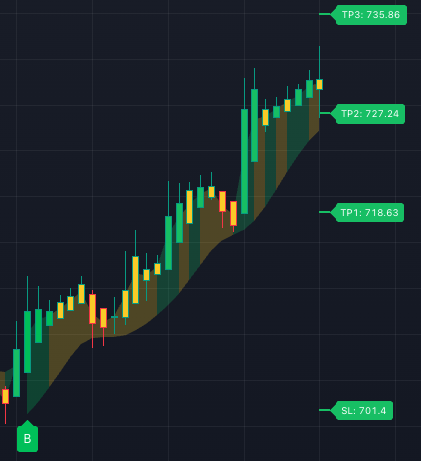
A setup is not complete until the risk structure is visible.
The Algo helps by drawing stop-loss and take-profit levels on the chart when a new Buy or Sell condition appears.
These levels are not random horizontal lines.
The script starts with ATR-based risk, checks recent structure, applies a risk mode, caps excessive risk, and then plots the stop plus three take-profit levels.
That gives you a practical planning framework before emotion takes over.
What the levels are designed to show
The stop-loss line helps you identify where the setup starts to lose structure.
The take-profit lines give you visible upside or downside checkpoints based on the calculated risk distance.
TP1, TP2, and TP3 are built around multiples of that risk distance so you can evaluate whether the chart has enough room to justify deeper review.
The risk mode controls how much room the trade structure gives the chart:
- High Risk Mode: wider stop, more breathing room.
- Medium Risk Mode: balanced default structure.
- Low Risk Mode: tighter stop, more useful for faster/scalping-style review.
How the script builds the structure
For long setups, the Algo looks below price using ATR and recent swing-low structure.
For short setups, it looks above price using ATR and recent swing-high structure.
It then chooses a practical stop area, protects against levels that are too tight or structurally invalid, and plots take-profit levels based on the resulting risk distance.
That gives you a cleaner way to ask: does this setup have room to work, or is the risk/reward structure too messy?
How to use SL/TP levels in review
After a signal appears, do not only ask whether direction looks right. Ask:
- Where is the stop-loss level?
- Where is TP1 relative to nearby support or resistance?
- Is the first target too close to justify the idea?
- Is the stop so wide that the setup no longer fits your process?
- Do Squeeze + Momentum and the HTF Panel support the risk you would be taking?
A strong signal with poor risk structure is still a hard chart to use.
A signal with confluence, clean levels, and visible risk/reward is easier to review objectively.
Why InsiderFinance makes risk planning cleaner
Many traders add risk levels after they already like the trade.
InsiderFinance brings risk planning onto the chart immediately, next to the signal, Confirm Line, support/resistance, and lower-pane context.
That keeps opportunity and risk connected from the start.
Your next step
Pick one recent signal and inspect the SL/TP structure before judging the setup.
If TP1 is crowded by resistance or the stop sits outside your tolerance, that is part of the decision.