Options Flow vs. Technical Analysis: Which Is the Best Indicator?

Options flow and technical analysis are two of the most powerful leading indicators for predicting short-term market direction.
Nearly every successful trader uses one or both of these to help them determine which trades have the most potential within the current market context.
Naturally, many traders want to know the best indicator to predict market trends: options flow or technical analysis.
What is Options Flow?
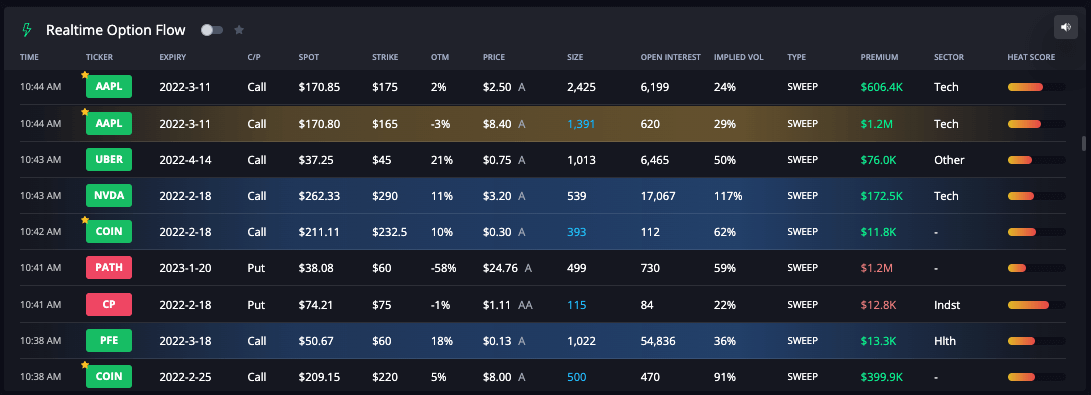
Options flow represents the 6 to 10 million options contracts traded daily.
Why Should Traders Care about Options Flow?
Options flow is one of the most accurate leading indicators for predicting short-term market movements. It gives retail traders visibility into the positions institutions take that often cause large market movements before the moves happen.
Understanding how to leverage options flow data can help traders predict short-term trends with high confidence and prevent disastrous trades.
What is Technical Analysis?
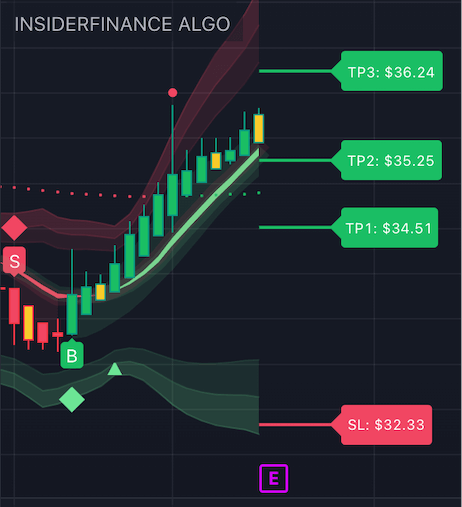
Technical analysis indicates future price movements and trends by evaluating historical price and volume data.
Why Should Traders Care about Technical Analysis?
High-potential trade ideas have a much higher chance of success when supported by robust technical analysis, so employing technical analysis can increase your win rate meaningfully.
How? Traders gain an edge when multiple technical indicators using different price concepts from various non-correlated techniques show the same trend.
Historically, trades made when technical indicators are in confluence have a higher potential of working out successfully.
HIGH POTENTIAL TRADES SENT DIRECTLY TO YOUR INBOX
Add your email to receive our free daily newsletter. No spam, unsubscribe anytime.
Options Flow vs. Technical Analysis
Traders face many situations where options flow data, and technical analysis indicators tell different stories.
For example, options flow data may show a very bullish trend while technical analysis indicates a bear trend. So how do you know which is right?
Options Flow as a Predictor of Price Swings
Typically, we consider options flow to be the best indicator for price swings.
After all, volume moves markets, and options flow has repeatedly proven to be the best predictor of large market movements.
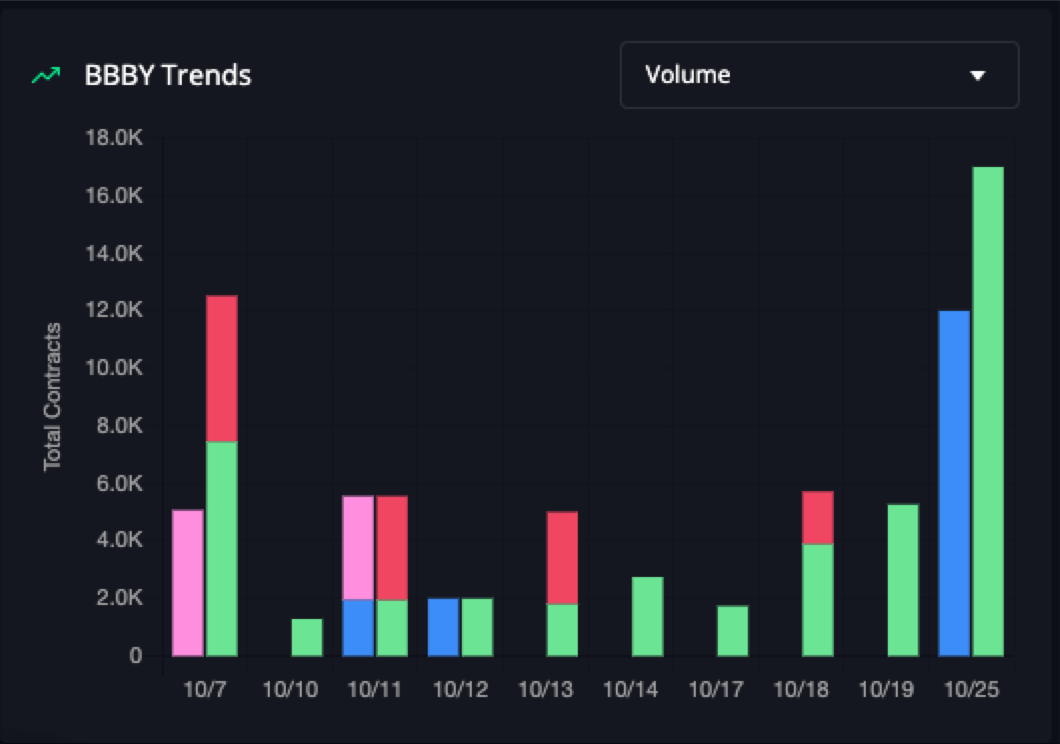
Options flow volume inherently incorporates a “knowledge” element not present in technical analysis.
Options flow represents an actual trade executed by a professional trader at an institution or by a high-frequency trading algorithm developed and rigorously backtested by a quant.
Real trades mean real money is on the line for these institutions and professional traders.
The trade’s direction (i.e. bullish or bearish) represents a professional trader’s confidence in the short-term market direction.
Smart Money Options Flow
Sometimes, the market direction is determined using non-public information that we aren't privy to.
Institutional investors (“smart money”) use their considerable resources to access market-moving information before other market participants.
Smart money uses this information advantage to confidently take significant (and often highly leveraged) positions that often cause sizable directional swings in the market.
Historically, smart money has used this substantial information advantage to outperform retail traders by a wide margin.
By analyzing the options flow, we can understand professional traders' sentiments and potentially discover a trade they made using a proprietary strategy (and take the same trade).
While the individual option flow trades account for the newest (and usually non-public) information the fastest for rapid price movements, we don’t know what quantitative data the trader considered before entering the trade.
That’s where technical analysis comes in.
Technical Analysis as a Predictor of Market Direction
Technical analysis uses sophisticated math to predict trends and market direction based on historical data. Large amounts of quantitative data are analyzed to determine the most likely price action that can be seen using visuals.
Historically, technical analysis has proven to be an excellent predictor of future price trends.
However, technical analysis may fall short as “new” information is introduced to the market, which could cause price movements in the opposite direction that technical analysis predicted.
Comparing Options Flow and Technical Analysis
Options Flow Strengths
- Excellent for accounting for the newest (and often non-public) information that hasn’t yet been priced into a stock, which serves as a leading indicator of rapid price movements before they occur
Technical Analysis Strengths
- Excellent for incorporating historical quantitative data to easily visualize the price trend with clear entry and exit points based on a quantitative approach
Incorporating options flow and technical analysis into their trading strategy gives traders the best chance of success (and the highest win rates).
The more data points that predict the same direction, the better the chances the market moves in that direction, a concept called confluence.
In a trading strategy using confluence, every trade decision is supported by several indicators and analyses, all in agreement, to increase the chances of success within the current market context.
Trading in Confluence with Options Flow and Technical Analysis
At InsiderFinance, we recommend trading in confluence and prefer to avoid trading when there's conflicting information.
Instead, we recommend finding a trade where the options flow and technical indicators agree.
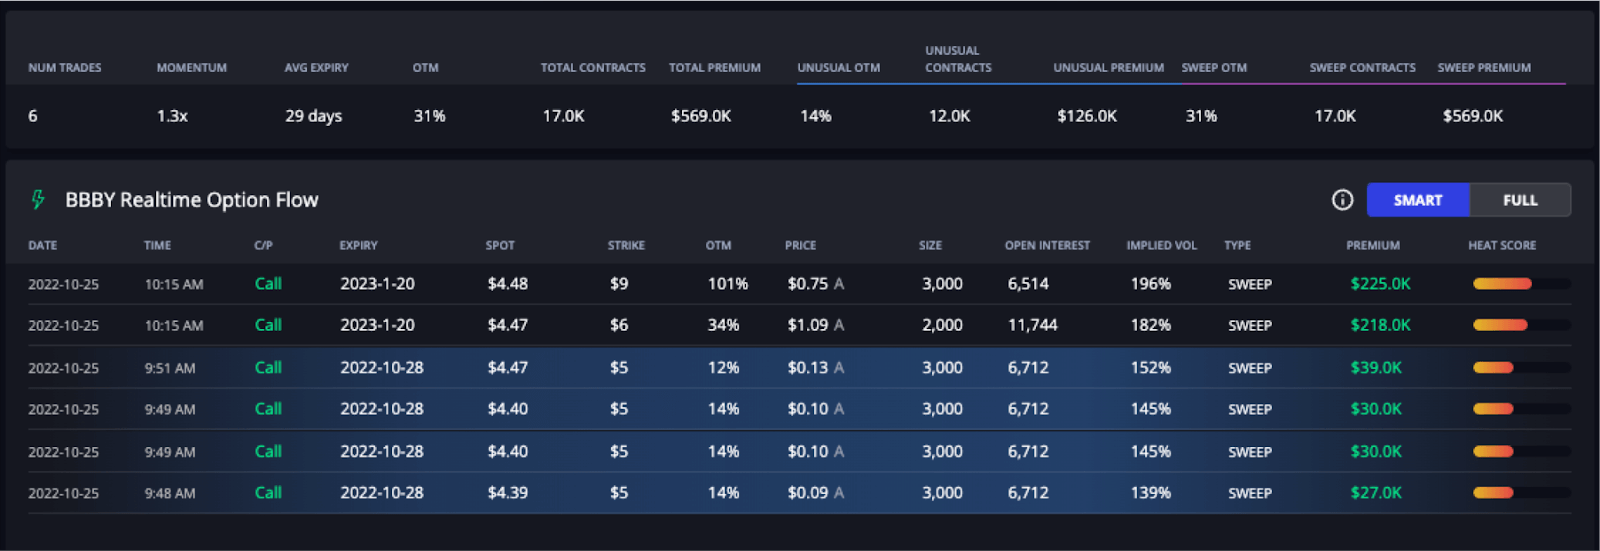
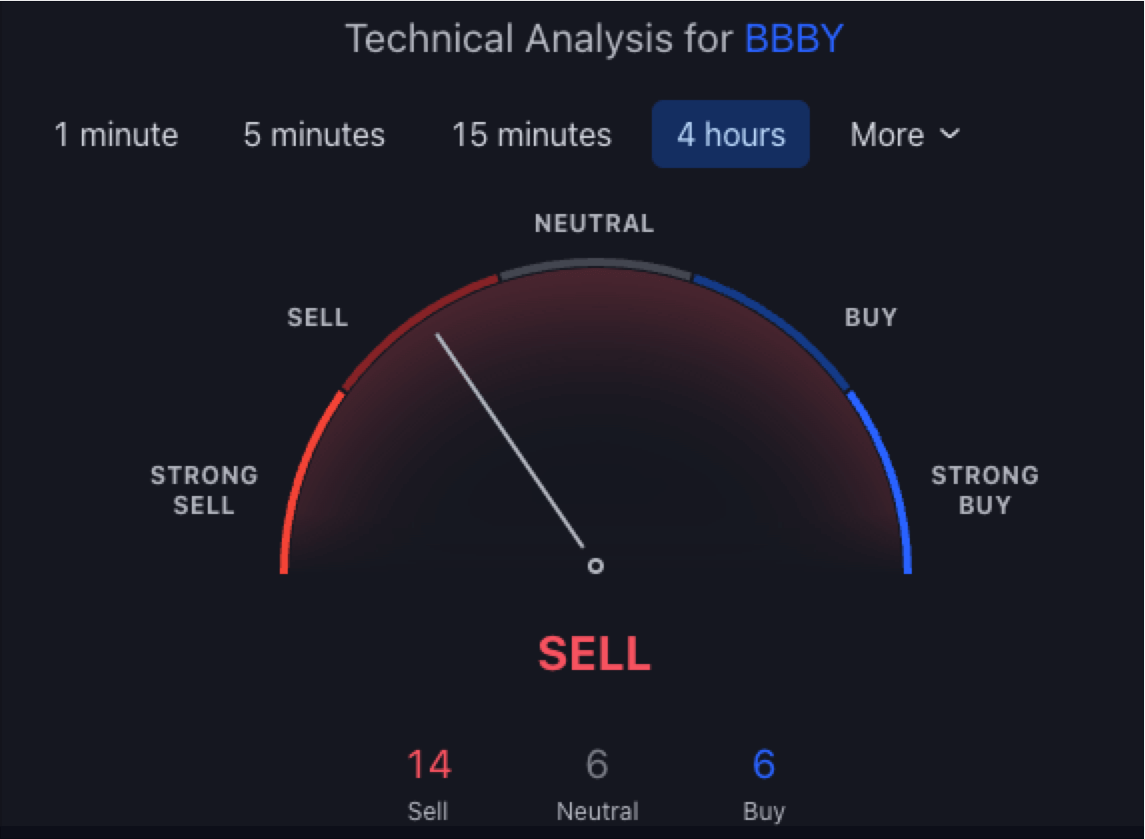
In the pictures of BBY above, you can see very bullish options flow but bearish technical indicators. Why enter a trade with a mixed outlook?
Let’s walk through an example where options flow and technical analysis agree.
Options Flow and Technical Analysis Case Study
The following case study will analyze the options flow and technical indicators for GM ahead of a significant market movement.
Options Flow Analysis
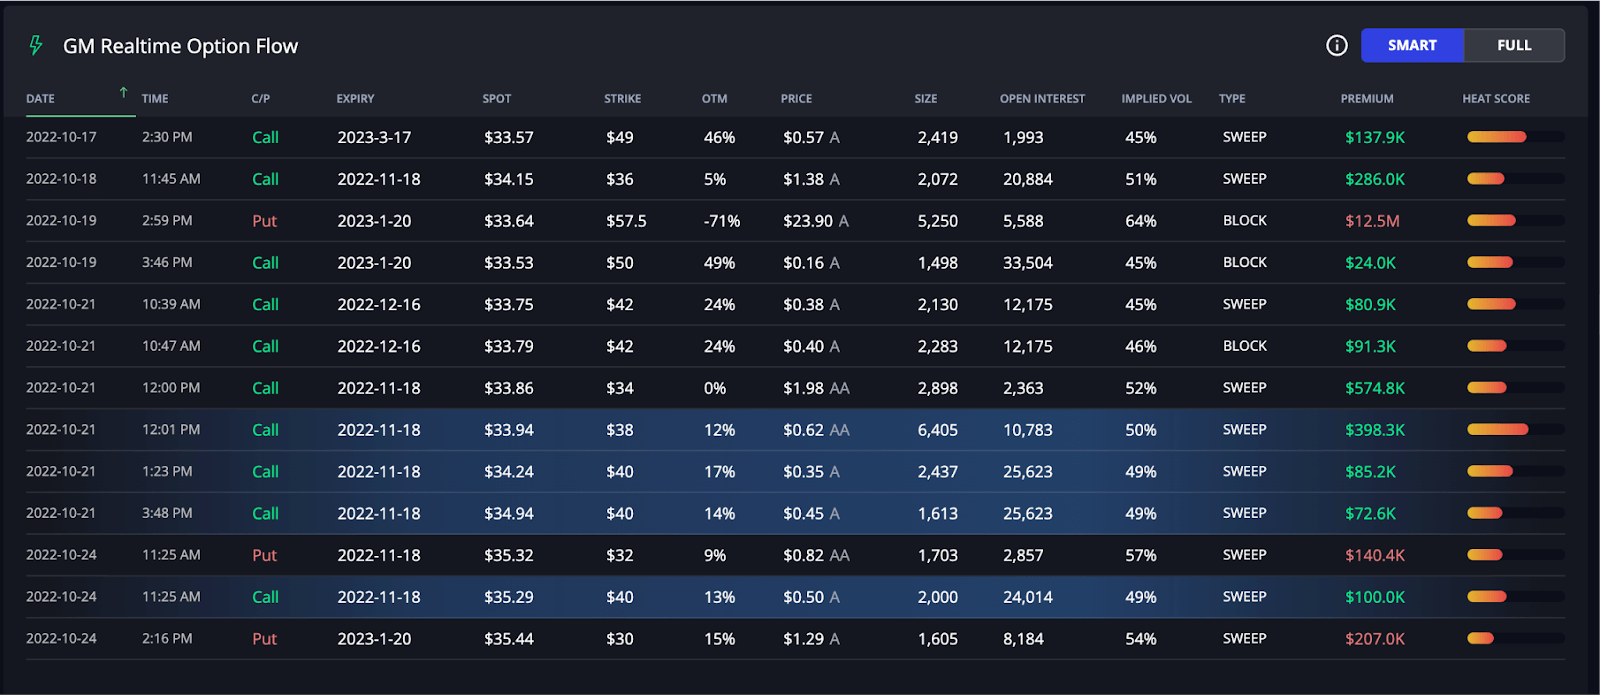
The table above shows GM options flow ahead of a substantial move. Notice a few points on the options flow:
- The majority of the overall options flow is bullish
- All of the unusual options activity (highlighted in blue) is bullish
- The options flow trades with the highest Heat Scores are bullish
- The large bearish put on 10/19 has an expiration date of 1/20, which can be interpreted as a longer-term bearish outlook that shouldn’t impact our short-term analysis
Given the points above, we can now conclude that the options flow for GM is very bullish.
That gives us great confidence in the short-term market direction, given real traders risked real money that GM will rise in the short term.
However, to ensure the highest chance of success in a profitable trade, let’s perform technical analysis and compare the results.
Technical Analysis Charts
The foundation of a confluence trading strategy that includes technical analysis is typically overlaying multiple technical indicators onto the same chart and comparing multiple time frames.
The InsiderFinance technical analysis system uses proprietary and well-known indicators from multiple sources to identify trends with unmatched accuracy.
Our high-performing indicators are in confluence for every buy/sell signal generated.
We recommend looking at multiple time frames to add another level of confluence. The "higher" the time frame, the longer "term" the trend.
- 1-Hour: Short Term
- 4-Hour: Long Term
- Daily: Macro Trend
We think of the daily chart as the macro "established" trend.
Traders have the best chance of success when trading in the same direction as the daily chart (i.e. taking a long position when the daily chart is bullish).
In this case study, we’ll skip the daily chart analysis to avoid being overly repetitive, but the daily chart showed a bullish trend.
4-Hour Chart
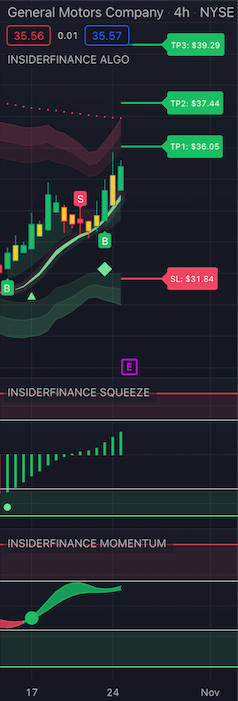
In the 4-hour chart above, we see the InsiderFinance 4-point confirmation on 10/17:
- Algo buy signal
- Squeeze buy signal
- Momentum buy signal
- Trend confirmation triangle
Based on the 4-hour chart above, we can conclude that GM started a long-term bullish trend on 10/17. Let’s see if our 1-hour chart tells a similar story.
1-Hour Chart
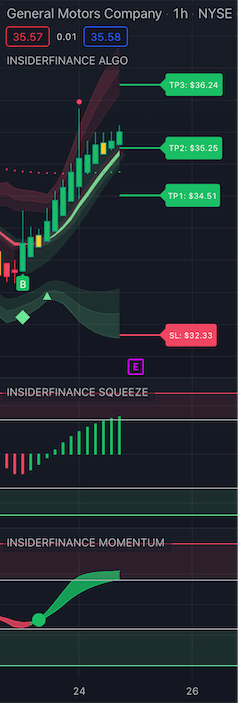
In the 1-hour chart above, we see the majority of the InsiderFinance 4-point confirmation on 10/21:
- Algo buy signal
- Swing diamond
- Squeeze change from bearish to bullish
- Momentum buy signal
Our technical analysis results agreed with our options flow data that a bull trend is likely the short-term market direction. That’s great news!
Once we know the market direction, we can enter a trade that fits our trading strategy and becomes profitable when the market moves in the same direction as our analysis (i.e. buy a call when our analysis predicts a bull trend).
News Sentiment
This article was primarily focused on comparing options flow and technical analysis, but for the best chance of success, we should also evaluate news sentiment before trading.
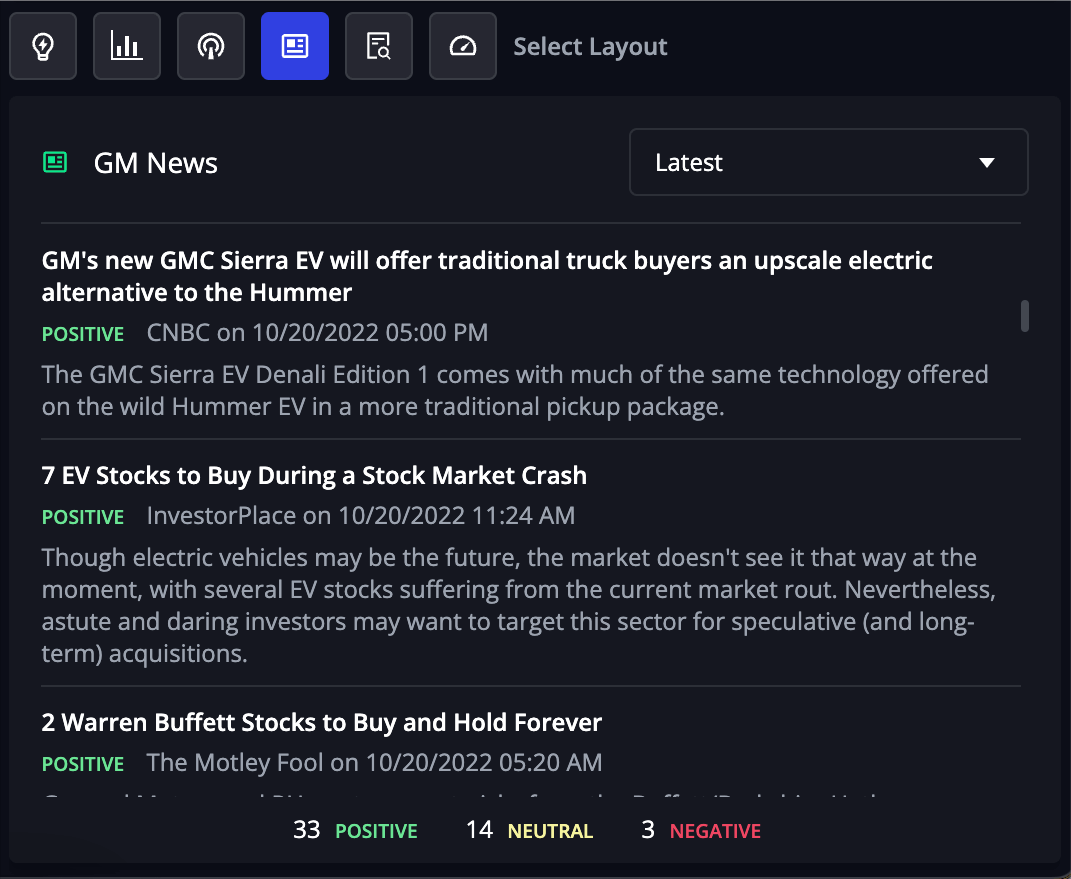
The above news sentiment analysis for GM is overwhelmingly positive, with no “red flag” articles, so we can still enter this trade confidently.
Dark Pool Prints
Another piece of information we should consider before entering a trade is dark pool, particularly dark pool levels.
Dark pool trades, or prints, are equity block trades executed over-the-counter (OTC) through a private exchange only available to institutional investors.
Dark pool trades can also be leading indicators of market movements.
Let’s take a look at the dark pool trades for GM below.
We see some dark pool activity, but we don’t see any clearly bullish or bearish trades identified through InsiderFinance’s intelligent tracking.
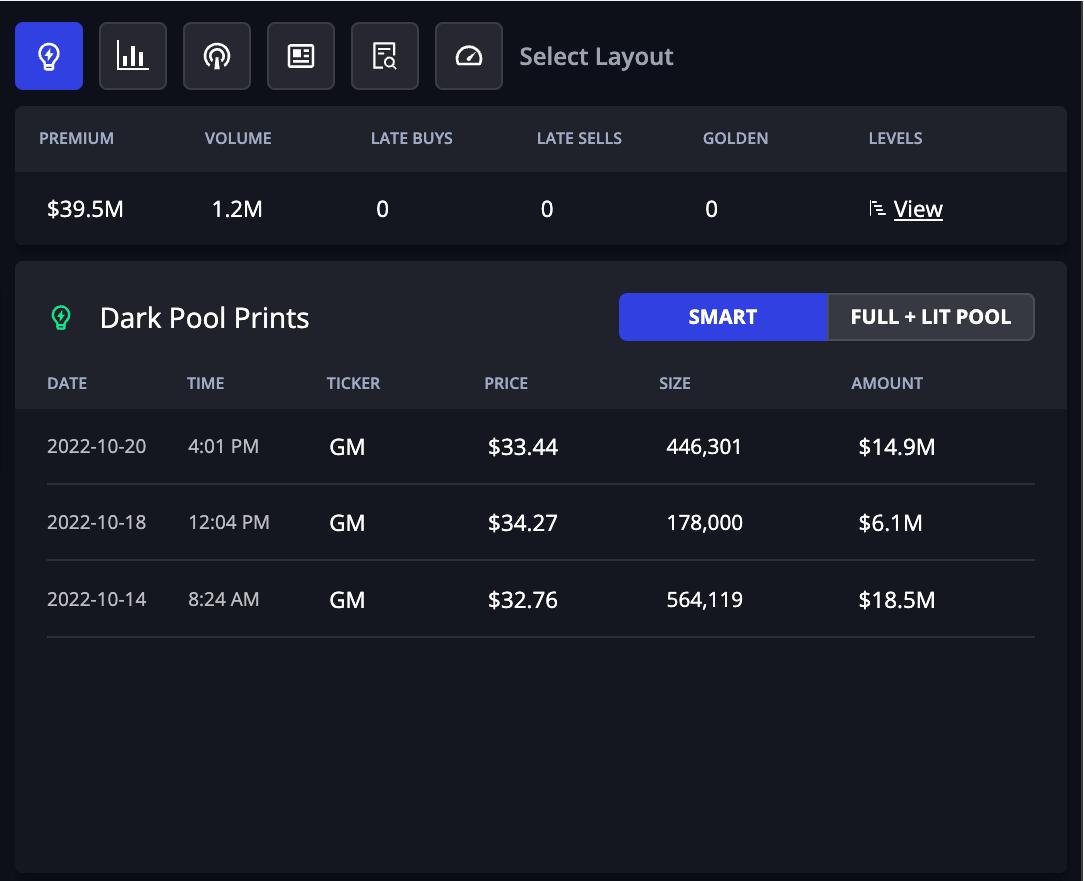
Even though we didn’t see any bullish or bearish signals, we can still use dark pool to determine potential support and resistance levels.
Tracking the price level that dark pool prints are trading over time helps identify support and resistance levels (i.e. dark pool levels).
Dark pool levels are beneficial in understanding whether the overall market is trying to break through a resistance level, which we would interpret as bearish overall, or held up by a strong support level, which we would interpret as bullish sentiment.
Let’s take a look at the dark pool levels for GM below.
Dark Pool Levels
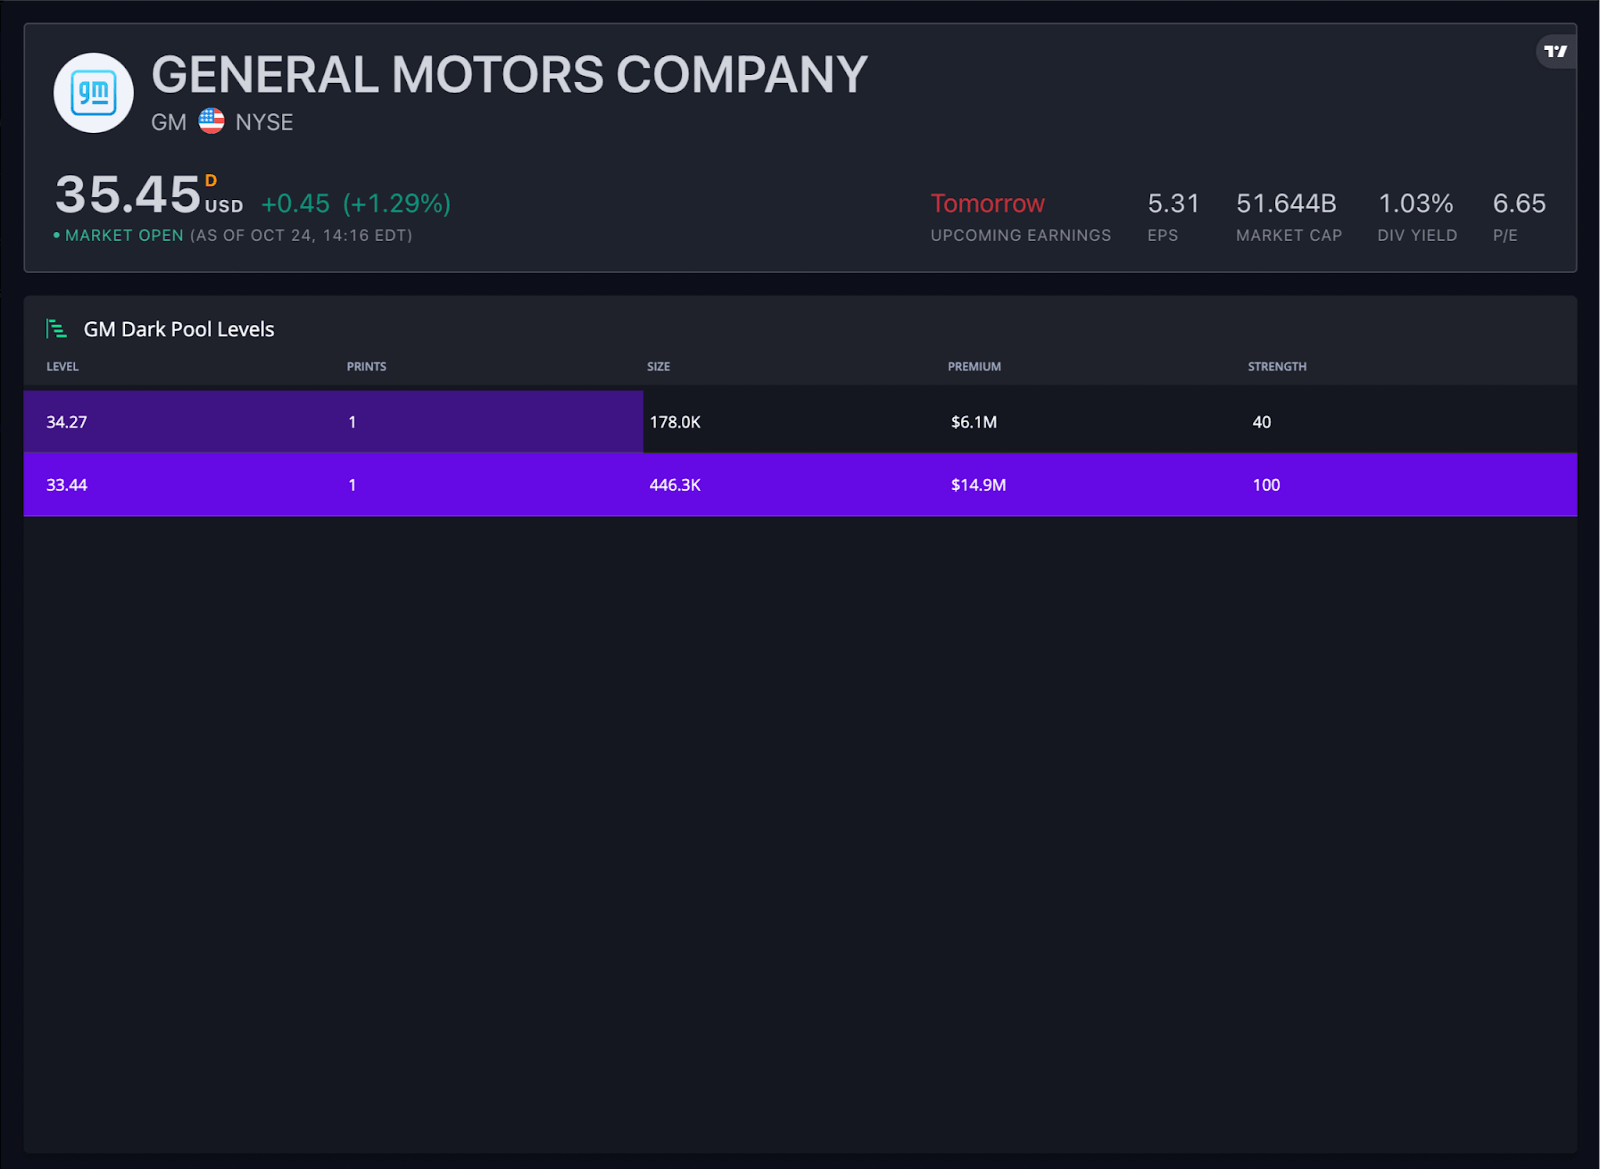
We see GM’s current price is $35.45, and a strong dark pool level formed at $33.44.
Because the current price of GM is above the strongest dark pool level, that price level serves as the near-term support level, which means the market could dip a little but likely not past that point.
A support level indicates that the overall sentiment is bullish, which also agrees with our analysis of options flow, technical indicators, and news sentiment.
We should feel confident entering this trade with many powerful data points in confluence!
Start Trading with Options Flow and Technical Analysis
So, what’s the best indicator to predict short-term market movements? A combination of options flow and technical analysis!
Start trading with options flow and technical analysis (and winning on more trades) today!
Remember to set stop losses and start with small amounts/paper trading, especially if these concepts are new to you. They’re powerful concepts that can significantly increase your win rate once you learn to use them, but always protect your capital as you learn something new.
HIGH POTENTIAL TRADES SENT DIRECTLY TO YOUR INBOX
Add your email to receive our free daily newsletter. No spam, unsubscribe anytime.


