Mastering Trading Multiple Time Frames

Many traders need help picking the best time frames for technical analysis, and understandably so.
Every charting tool has an endless list of time frames available, potentially showing different trends, so choosing the “right” time frames for trade decisions can feel daunting.
The good news is we have recommendations on which time frames work best for certain trade styles.
Here, we walk you through the steps of choosing the right time frames, complete with a case study so that you can trade more confidently.
Trading Multiple Time Frames
Using a single time frame for technical analysis can present a skewed market view, causing traders to miss critical price movements, overreact to “noise,” or fall victim to false signals.
To avoid these common mistakes, traders should analyze multiple time frames to gain a more holistic understanding of the markets and look for trade opportunities where multiple time frames show the same trend, a concept called confluence.
Historically, trades made in confluence have a higher probability of success.
Using confluence, every trade decision is supported by several time frames in agreement, strengthening confidence in market trends and ultimately leading to more disciplined and successful trades.
At InsiderFinance, we recommend using a three time frame framework to make trade decisions:
- Short-Term
- Long-Term
- Macro
Macro Trend
The macro trend is the "established" trend. You have the best chance of success when you trade in the same direction as the macro trend (i.e. taking a long position when the macro trend is bullish).
We typically think of the Daily chart as the macro trend, but if you're planning a very quick in and out, the 1-hour or 4-hour may serve as the macro trend.
The longer you plan to hold, the higher the time frame you want to use as your macro trend.
Long-Term Trend
The long-term trend tells you which direction that ticker is likely moving for the day.
If the long-term trend changes direction, your macro trend is also at risk of changing directions shortly.
Short-Term Trend
The short-term trend helps you plan entries/exits, but even if your short-term chart turns the opposite of the macro chart, the overall trend may still be intact if you see the same trend on the long-term and macro charts.
So even though the short-term trend may turn opposite to your macro trend, that doesn’t necessarily mean you should exit immediately.
Typically, we lock in some profits early using pre-determined take-profit levels. That de-risks the trade and lets you play with some “house money.”
To decide when to exit the remainder of the position, we watch the long-term chart to see when the trend ends.
Best Time Frames for Day Traders
Day traders need faster and shorter time frames to execute their trades effectively within the day. The three best time frames for day traders include:
- 1-Minute or 5-Minute (Short Term): Ideal for capturing short-lived price movements and identifying quick trading opportunities.
- 15-Minute (Long Term): Offers a balanced view of market trends, minimizing erratic price fluctuations while providing timely insights.
- 1-Hour (Macro): This slightly longer time frame smoothens out intraday noise, providing a broader perspective of the day's activity.
Best Time Frames for Swing Traders
Swing traders, who typically hold positions overnight or for several days, need longer time frames to assess potentially profitable trends. The three best time frames for swing traders are:
- 1-Hour (Short Term): Provides an overview of short-term trends, allowing traders to pinpoint subtle shifts in momentum.
- 4-Hour (Long Term): Offers more significant insights for swing traders without getting overwhelmed with irrelevant fluctuations.
- Daily (Macro): Essential for identifying long-term moves and emerging patterns, thus enabling swing traders to capitalize on more sustained trends.
HIGH POTENTIAL TRADES SENT DIRECTLY TO YOUR INBOX
Add your email to receive our free daily newsletter. No spam, unsubscribe anytime.
Case Study: MSFT
To bring these concepts together, we’ll walk through an example of a bullish swing trade on Microsoft (MSFT) using the InsiderFinance Technical Analysis System.
First, we’ll use our three time frame framework to see if we can enter the trade.
Trade Entry
We’ll start by checking out the Daily chart since we plan to hold for a few days.
Is the daily chart bullish? If so, the macro trend is bullish, and we can check other time frames to confirm the short-term trend.
If not, we’re going to look for another trade idea instead.
Daily Chart
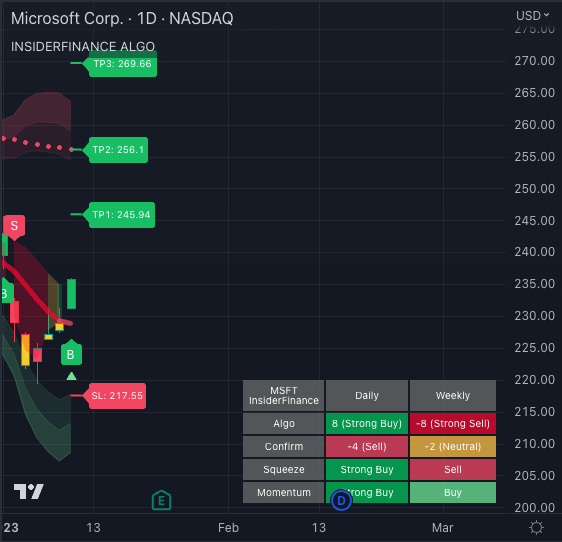
We can see above that the Daily chart shows a Strong Buy reinforced by a bull Trend Triangle.
We also see Strong Buys on the Squeeze and Momentum indicators, so we’re ready to check the 4-hour chart.
If the 4-hour chart is bullish, both the macro and long-term trends agree.
If the long-term trend isn't bullish, we will look for another trade idea.
4-Hour Chart
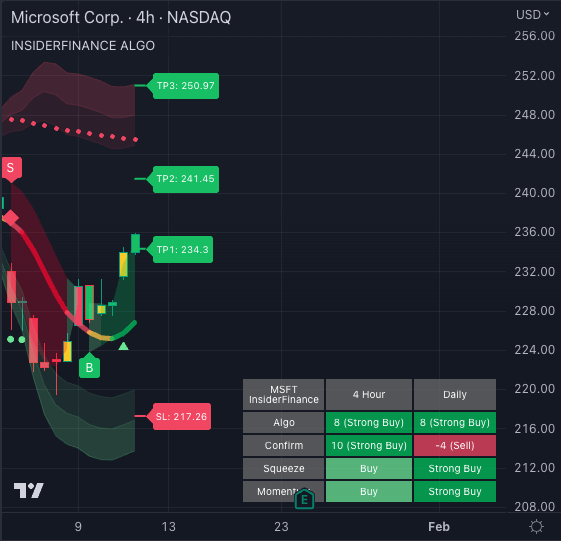
We can see above that the 4-hour chart shows a Strong Buy on both the Algo and Confirm, along with another bullish Trend Triangle.
We also have Buy signals on the Squeeze and Momentum indicators, so we’re ready to check the 1-hour chart to plan our entry.
If the 1-hour chart is bullish, now we have three bullish trend confirmations on different time frames, so the trade is backed by robust technical analysis.
Assuming we don’t see any bearish options flow, we’re good to trade!
1-Hour Chart
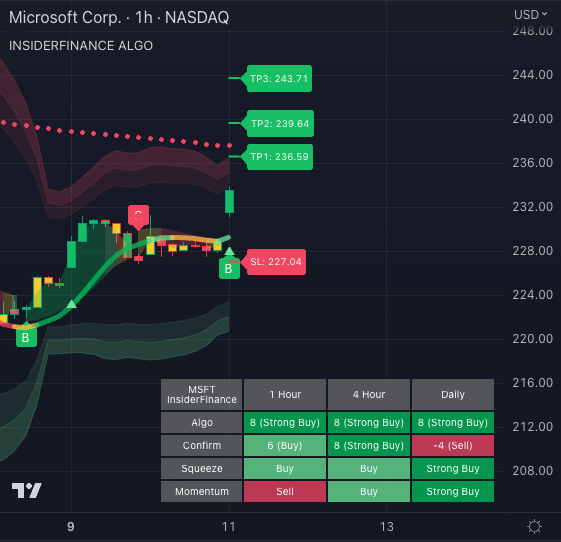
We can see from the above chart that we have a Strong Buy from the Algo reinforced with a bullish Trend Diamond.
We also see a Buy from the Confirm and Squeeze indicators, so we’re ready to enter the trade!
While we still like to check our time frames individually before entering, our Technical Analysis System automatically displays the trends on higher time frames to expedite our analysis.
When to Exit
Now that we’re in the trade, how do we know when to exit? There are a few promising signs it may be time to exit:
- The price hits the take profit or stop loss levels
- The long-term trend or daily trend turns bearish
- Option order flow turns bearish
Take Profit and Stop Loss Levels
Take profit and stop loss levels are generated each time there's a buy or sell signal, so it can be helpful to write them down if you don't enter them in your brokerage immediately.
Take profit and stop loss levels are also included in our automated alerts.
Another question may be, which take profit and stop loss levels do I use?
We typically recommend the levels from your short-term chart since that's the time frame you use to plan entries and exits.
We’ll use the take profit and stop loss levels from the 1-hour chart (the short-term trend in this example).
Long-Term Trend Reversal
Another reason you may exit is if the long-term or macro trend reverses.
If the short-term chart changes from bullish to bearish, that may not mean you need to exit.
This happens frequently in the markets, but as long as your longer-term trends hold, the short-term trend may return to a buy shortly.
Is there an easy way to monitor all these time frames? The answer is yes!
We typically set automated alerts on all three time frames for any position we enter to monitor trend changes effortlessly.
Bearish Options Flow
Even if our technical analysis looks excellent, we may exit a position if we see strong bearish options flow.
Options flow volume inherently incorporates a “knowledge” element not present in technical analysis.
Options flow represents an actual trade executed by a professional trader at an institution or by a high-frequency trading algorithm developed and rigorously backtested by a quant.
Actual trades mean real money is on the line for these institutions and professional traders.
The trade’s direction (i.e. bullish or bearish) represents a professional trader’s confidence in the short-term market direction.
We maximize our chances of success by using options flow and technical analysis together.
Trade Exit
Now that we’ve discussed potential signs to exit a trade, we’ll look at possible exit points to see the best time to exit the trade.
We’ll primarily focus on the 1-hour chart as we use the short-term time frame to plan entries and exits.
Short-Term Time Frame Analysis
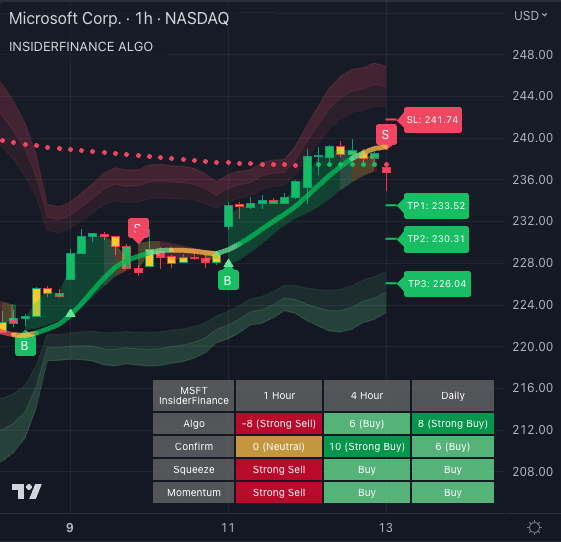
Two days after entering, we received an automated alert saying the 1-hour time frame had changed trend.
As you can see, we’ve already made a nice profit in just two days!
Our trade is well past the 1st take profit level and touched the 2nd, so we should have taken most of our initial capital out of the trade by now.
Looking at the chart, we now see a sell signal on the 1-hour chart, but our long-term and macro trends are still strong. Should we sell?
Since we’ve already de-risked the trade and the long-term and macro trends are still bullish, let’s hold and see what happens.
Extending Returns without Risk
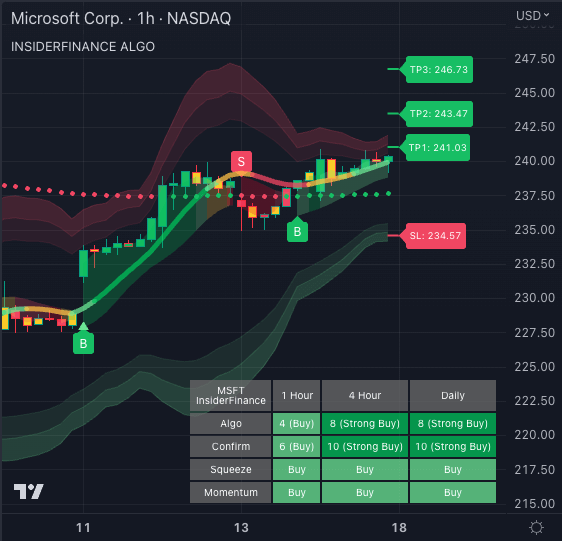
Five days later, more profits!
How long could we have held this trade? Let’s take a look at the Daily chart.
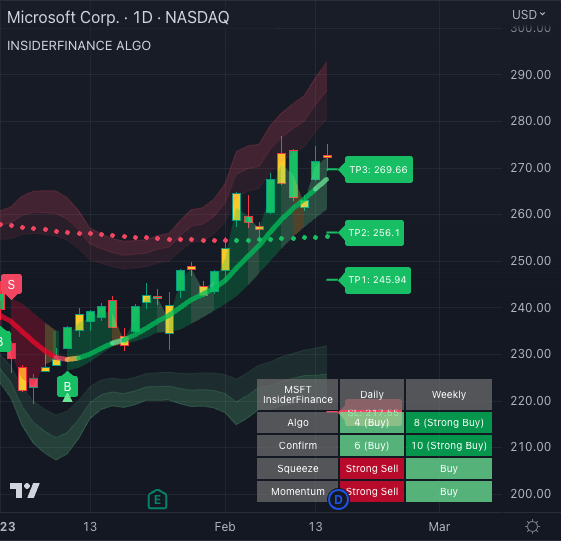
The Daily chart held a buy signal for 13 days!
That’s a long time with plenty of opportunities to make a profit if you’re patient and keep the big picture (i.e. multiple time frames) in perspective.
Increase Your Win Rate Today
Now you’re ready to trade in confluence with multiple time frames and increase your win rate!
Don’t forget to use award-nominated technical analysis tools to trade faster and more confidently.
Automated alerts and higher time frame analysis save significant time and take the guesswork out of reading charts.
HIGH POTENTIAL TRADES SENT DIRECTLY TO YOUR INBOX
Add your email to receive our free daily newsletter. No spam, unsubscribe anytime.


