Intelligent Dark Pool Tracking
InsiderFinance identifies dark pool prints and displays them in the dashboard's dynamic side bar with intelligent tracking and highlighting.
What do we track?
Late Buys and Sells (Orders with Delayed Reporting)
InsiderFinance highlights dark pool prints that are reported late. Institutional investors execute trades on European dark pools as a loophole to avoid reporting trades until hours later or even the next trading day.
Due to the nature of how dark pool orders are filled and reported, a trade may be delayed up to 24 hours before being made public.
These are the trades that institutional investors make an extra effort to hide.
Identifying Late Buys and Sells
How do we identify them?
The spot price on these trades is outside the day's price range—it is higher than the current day’s high price or lower than the current day’s low price—so we know these trades couldn’t have been traded during the current trading session.
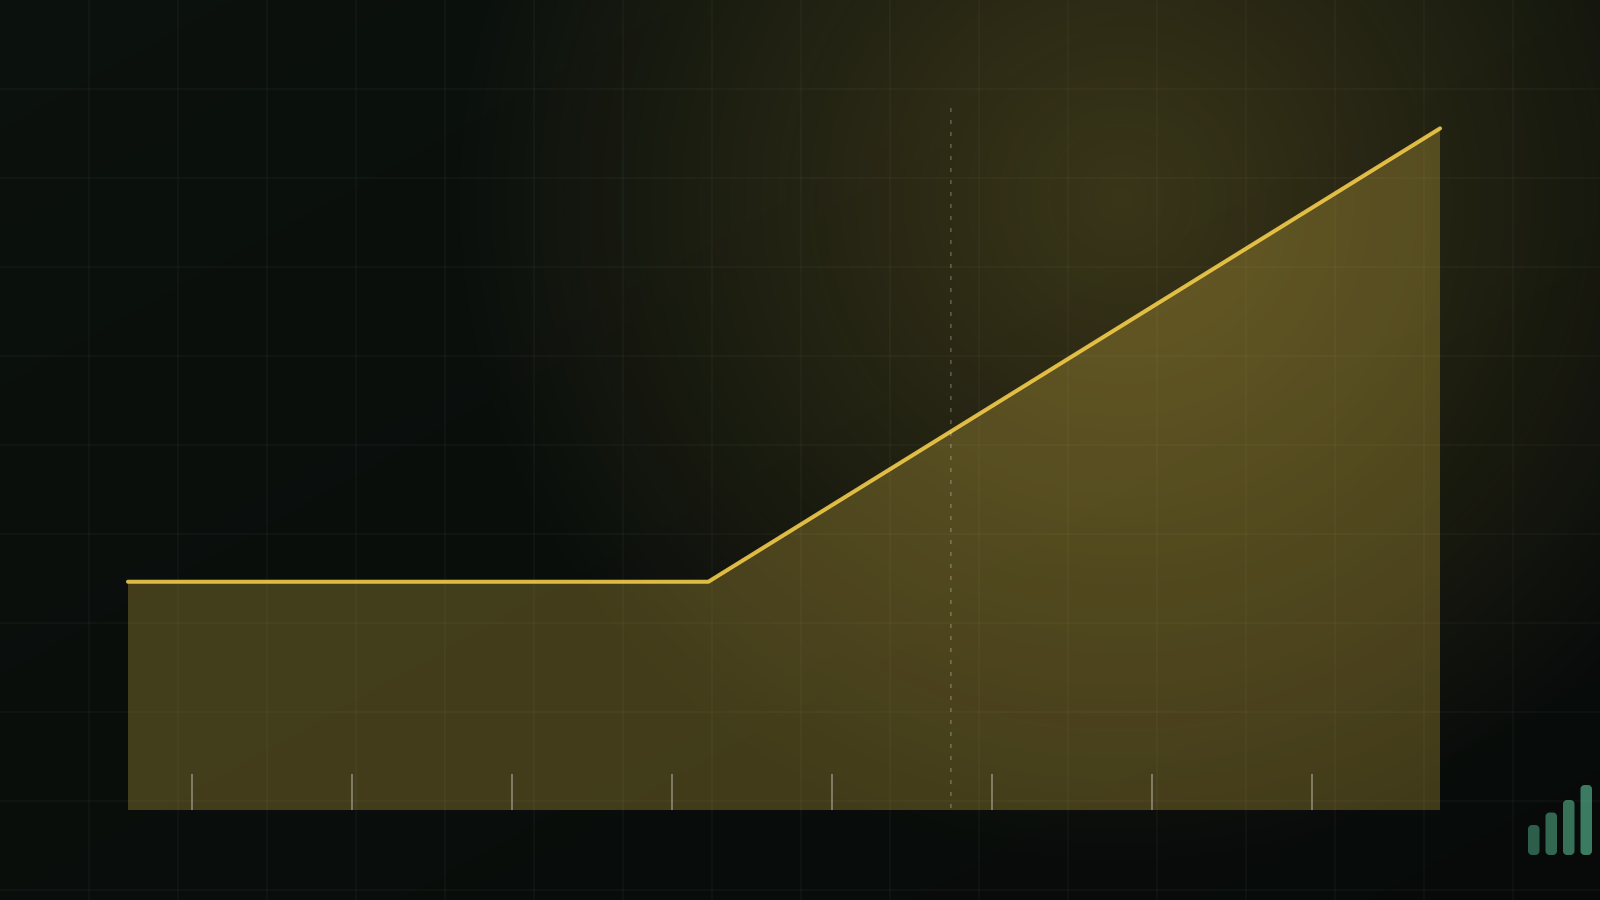
If you see multiple late buys or late sells on the same ticker, this could indicate the beginning of a trend.
Dark pool prints traded below the open of the current trade day are highlighted in green and imply bullish sentiment.
- This means an institution bought the stock before it increased in price the following day.

Dark pool prints traded above the open of the current trade day are highlighted in red and imply bearish sentiment.
- This means an institution sold the stock before it decreased in price the following day.

InsiderFinance also identifies late buys and sells on ETFs for major indexes like SPY, QQQ, IWM, or DIA, sometimes called signature prints.
Counting Late Buys and Sells
InsiderFinance also counts these late orders, so it’s easy to identify when multiple orders are coming in for the same ticker.

ETFs
- 20+ delayed orders on an ETF ticker like SPY, QQQ, IWM, or DIA is considered high activity.
Equities
- 2-3 delayed orders on a non-ETF ticker can be worth investigating.
When you start to see multiple late orders come in (per the above criteria), pay close attention to any trends/reversals that may be occurring. The trend/reversal is most likely to be validated after a day of high activity.
HIGH POTENTIAL TRADES SENT DIRECTLY TO YOUR INBOX
Add your email to receive our free daily newsletter. No spam, unsubscribe anytime.
Insight for Major Indexes (SPY, QQQ, IWM, and DIA)
InsiderFinance helps you identify whether a trend is continuing or a potential reversal could be starting by adding trend dots to late trades on major indexes (SPY, QQQ, IWM, and DIA).
We show red or green trend dots next to major index trades to identify whether the current spot price is above or below the spot price when the trade was reported.
Bullish or Bearish Trends on SPY, QQQ, IWM, and DIA
A green dot indicates that the stock's current price is above the dark pool print's trade price, implying a bullish trend.

A red dot indicates that the stock's current price is below the dark pool print's trade price, implying a bearish trend.

Interpreting Potential Trends/Reversals on SPY, QQQ, IWM, and DIA
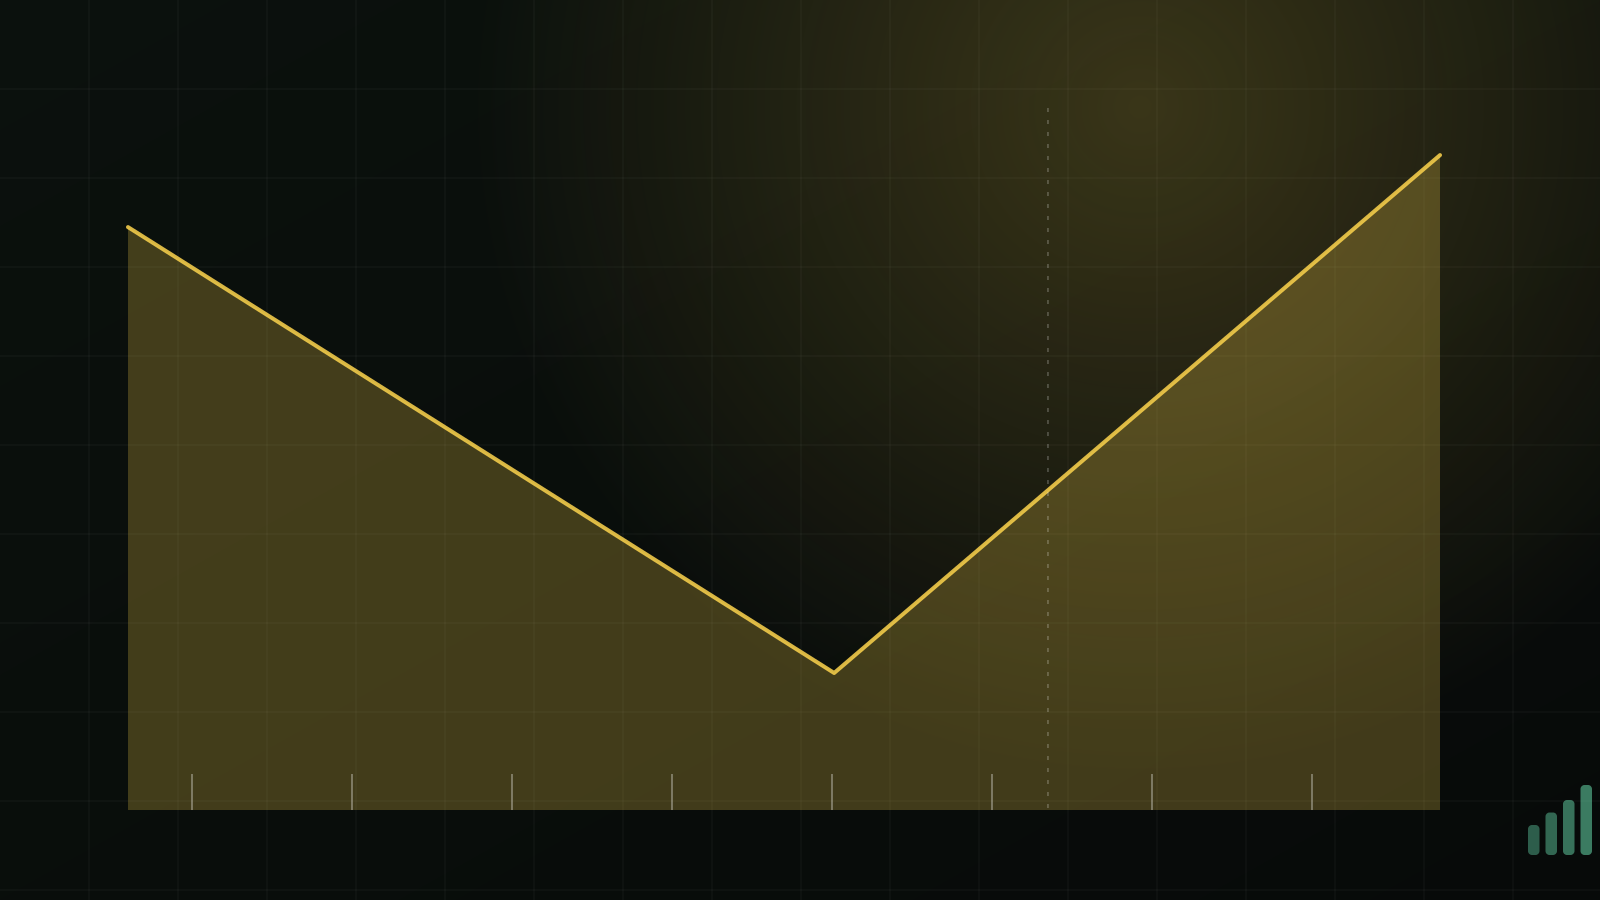
Late buys and sells on major index ETFs can help spot potential market tops and bottoms.
Combining late buys and sells (green and red highlights) with trend dots (green and red dots) makes it easy for you to identify whether a trend is continuing or a potential reversal could be starting.
This is where our dark pool tracking becomes very powerful and helpful.
Late Buy + Green Dot → Bull Trend
Late Buy + Red Dot → Possible Bear Reversal

Late Sell + Red Dot → Bear Trend
Late Sell + Green Dot → Possible Bull Reversal

The key difference between the highlight and the dot is comparing the dark pool trade to the opening price versus the current price.
This gives you perspective on how the ETF is moving currently versus how it started the day.
It may have started bullish (green highlight) but now be bearish (red dot) meaning a possible bear reversal is coming.
This powerful combination can be used to catch the next market top or bottom before it occurs.
Unusually High Volume Orders
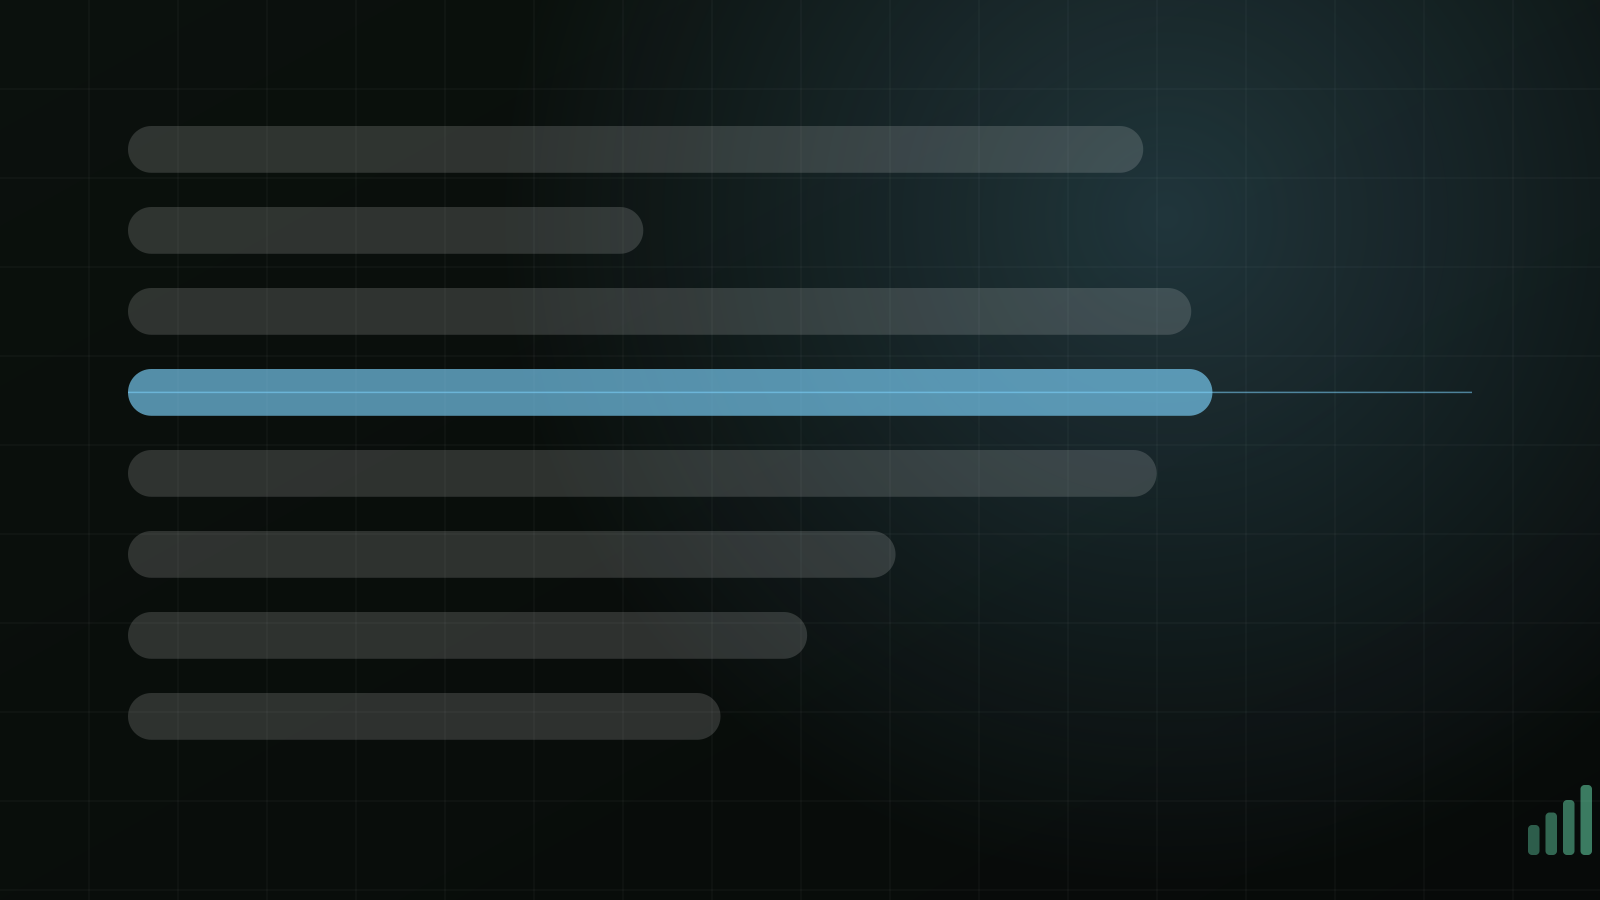
Dark pool prints where the block size is at or above 30% of the stock’s daily average volume can be particularly interesting and significant.
InsiderFinance makes these trades easy to spot with a gold box around the order size.

Large Premium Orders
Dark pool prints with a notional value above $50 million are also worth watching.
InsiderFinance makes these trades easy to spot with blue text on the notional amount.

Are Orders Buys or Sells?
Unlike options orders where a market maker can easily create a trade out of nothing by simply “writing” it, equity shares cannot be created.
Why is this important?
The bid and offer are significant on options orders because they clearly indicate whether the order is a buy or a sell.
However, because equity shares cannot be created, every transaction has a buyer and a seller.
And due to the nature of how orders are filled in dark pools, the order side (bid, mid, or ask) can actually be misleading.
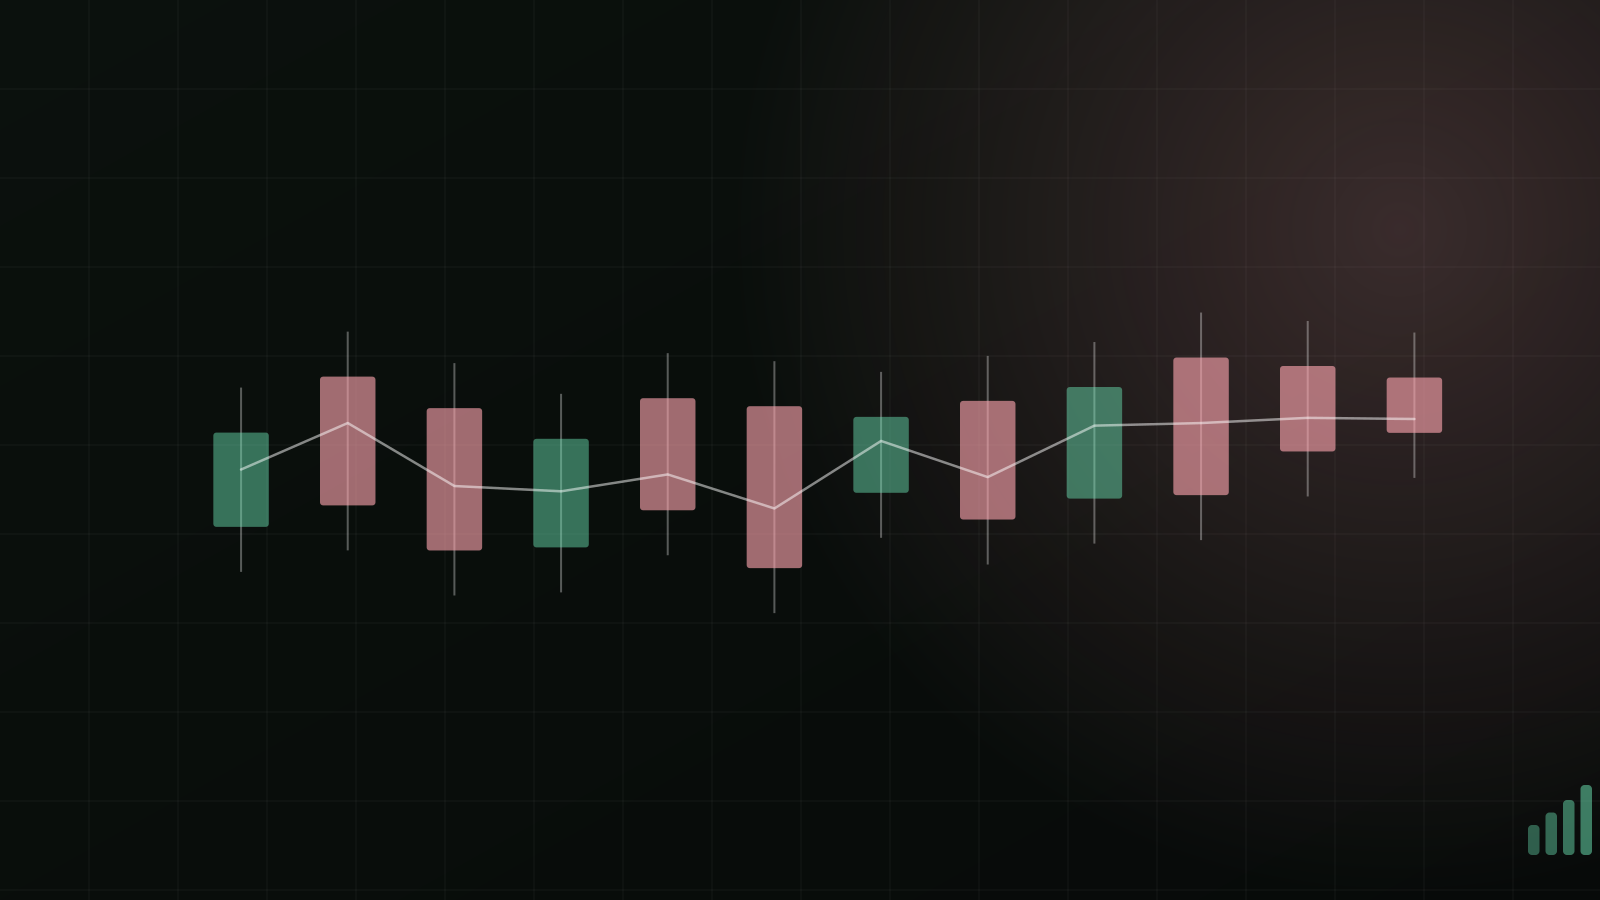
That means the order side isn’t important for dark pool trades. Instead, what’s important is the price action following a large trade.
Paying attention to the spot price of the order is the best way to tell if an order was executed with a bullish intent or a bearish intent.
- Trade executed with a spot price below the nearish resistance level then breaks above it is a bullish signal.
- Trade executed with spot price above nearest support level then breaks below it is a bearish signal.
What Is a Lit Pool?
Lit pools are the opposite of dark pools. A lit pool refers to a public stock exchange where the order book is openly displayed and available for all participants.
This means that traders using a lit pool can see the amount of liquidity in the bid and offer for a security through the order book, which can be used to gauge the short-term direction of a stock.
How Are Lit Pools Different from Dark Pools?
The main difference is dark pools don’t have public order books or show the prices a buyer or selling is willing to pay while, in contrast, lit pools publicly display the various bids and offers for stocks listed on the exchange.
Where to Find Lit Pool Prints
InsiderFinance also tracks “lit” pool prints, or large equity blocks traded through public exchanges, and displays them on the Ticker Research page.
Final Advice
Dark pool prints and large equity blocks are only one piece of data and should be used in conjunction with options order flow and technical analysis to support trade decisions.
For equities, look for tickers that don’t hit the tape as often or where multiple late buys and sells are identified.
For ETFs, pay attention to high activity days (20+), understand bullish or bearish sentiment, and look for trend validations or possible reversals.
HIGH POTENTIAL TRADES SENT DIRECTLY TO YOUR INBOX
Add your email to receive our free daily newsletter. No spam, unsubscribe anytime.