How to Read Gamma Exposure (GEX) Like a Pro
Gamma exposure is most useful when you stop treating it like a price target and start reading it as a live map of pressure.
The question is not “where will SPY go?” It is “where can hedging flows make price sticky, unstable, resistant, or vulnerable?”
This article is the practical companion to The Ultimate Guide to Gamma Exposure (GEX). Start there for the foundation; use this guide to apply the workflow: regime → gamma flip → walls → expiration concentration → confirmation.
Below, we walk through that process using live SPY examples from InsiderFinance Gamma Exposure: the summary strip, GEX heatmap by expiration, open-interest profile, IV simulation, intraday ΔGEX tracker, signals, and gamma squeeze screener.
Gamma Exposure Explained Simply
Gamma is the rate of change of delta. Gamma exposure extends that idea from a single option to an entire option chain by aggregating gamma across strikes and expirations, usually with open interest as the public proxy for positioning.
In practical terms, GEX estimates how much dealer hedging pressure may change as the underlying moves.
Traders use it to answer two questions: is hedging more likely to dampen or amplify volatility right now, and which price levels matter because hedging pressure is concentrated there?
That is why GEX is useful for intraday and short-term trading. It does not tell you what price must do. It tells you where the market’s mechanical backdrop is more likely to be sticky, unstable, supportive, or dangerous.
Public research on gamma imbalance and 0DTE trading supports the stabilizing-versus-amplifying intuition: when dealers are long gamma, hedging can dampen moves; when they are short gamma, hedging can propagate moves.
What Each GEX Number Actually Tells You
| Metric | What it answers | Best use |
|---|---|---|
| Net GEX | Is the overall hedging backdrop more stabilizing or more amplifying? | Regime read |
| Total GEX | How much aggregate gamma sensitivity exists overall? | Scale read |
| Call GEX | Where is upside gamma concentration strongest? | Resistance / call wall analysis |
| Put GEX | Where is downside gamma concentration strongest? | Support / put wall analysis |
| Gamma Flip / Zero Gamma | At what price does the regime change sign? | Regime boundary |
| Peak GEX Strike | Where is absolute gamma concentration highest? | Magnet / pinning analysis |
Net GEX is the headline number because it tells you whether the environment is more likely to behave like mean reversion or momentum.
Total GEX still matters, but it answers a different question: how much gamma sensitivity exists in the chain overall.
You can have large total GEX with a mixed read if call and put contributions offset each other.
The call/put split is where the nuance lives.
If net GEX is positive but the dominant concentration sits in heavy call gamma just above spot, the ceiling matters more than the net number.
If put gamma is dominant below spot, the floor matters more.
The net number tells you the regime; the call/put split tells you where that regime is coming from.
Different tools can disagree on the headline number while still telling a similar structural story.
Some GEX pages, for example, disclose specific display assumptions such as default expirations and move assumptions, while other platforms may aggregate more of the chain or use different defaults.
Expiration selection, units, updating frequency, and model conventions all matter.
How to Read Gamma Exposure in the Right Order
1) Start With the Regime
In a positive gamma environment, hedging tends to be counter-cyclical: selling into strength and buying into weakness. That usually supports tighter ranges, cleaner mean reversion, and more pinning behavior.
In a negative gamma environment, hedging tends to be pro-cyclical: buying as price rises and selling as price falls. That usually supports wider ranges, faster tape, and more violent continuation.
This does not mean positive gamma is bullish or negative gamma is bearish. It means the market is more likely to absorb or amplify a move once that move begins.
That distinction is critical. Regime tells you how to trade the tape; it does not tell you where the tape must go.
2) Find the Gamma Flip
The gamma flip, also called zero gamma, is the price where aggregate net gamma changes sign.
Above it, the hedging backdrop is usually more stabilizing. Below it, the hedging backdrop is usually more amplifying.
When spot is sitting close to the gamma flip, your confidence should drop because a small price move can change the regime.
For practical use, the key point is simple: do not read a positive or negative GEX number without also asking where spot sits relative to the flip.
3) Map the Call Wall, Put Wall, and Magnet
After the regime, map the important levels:
- Call wall: the key upside strike where call-side gamma concentration is strongest.
- Put wall: the key downside strike where put-side gamma concentration is strongest.
- Magnet / peak GEX strike: the level most likely to attract price in a calmer, positive-gamma environment.
The call wall identifies key upside resistance, and the put wall shows key downside support.
These levels are not magic, but they are useful because they show where hedging pressure is most concentrated.
4) Check Which Expiration Is Actually Driving the Setup
This is where many GEX reads break. The all-expirations view is useful, but it may not be the view controlling today’s tape.
Gamma is typically highest near the money and near expiration, which means 0DTE and the nearest weekly often dominate intraday structure.
The Options Industry Council notes that gamma is highest for at-the-money options near expiration.
Cboe reported that SPX 0DTE options averaged 2.3 million contracts daily in 2025, representing 59% of SPX volume, and that August 2025 set a record at 62.4% of overall SPX volume.
That is why an all-expirations view can be structurally correct but tactically incomplete. The broad chain tells you the larger backdrop. The active near-term expiration tells you what is most reactive today.
5) Confirm With OI, Flow, and Intraday Change
Open interest tells you where contracts exist.
GEX tells you how mechanically sensitive those contracts may be as price moves.
Flow tells you what traders are adding, lifting, pressing, or abandoning right now.
FINRA explains options as derivative contracts tied to an underlying asset and notes that they carry substantial risk; that risk is exactly why traders should avoid treating any single GEX level as a complete trade thesis.
A strong read usually has four things aligned: a clear regime, nearby key levels, expiration concentration, and confirmation from OI or intraday flow.
A weak read usually has conflicting expirations, thin OI, stale data, or a major catalyst about to override the map.
HIGH POTENTIAL TRADES SENT DIRECTLY TO YOUR INBOX
Add your email to receive our free daily newsletter. No spam, unsubscribe anytime.
Gamma Flip, Call Wall, Put Wall, and Peak GEX Explained
Gamma Flip / Zero Gamma
The gamma flip is the regime boundary. If the underlying is above its zero-gamma level, the chain is generally behaving more stabilizing.
If the underlying falls below it, the chain can become more reactive and unstable.
The closer price is to the flip, the more fragile the regime read becomes.
The practical read is not simply “above the flip is safe” or “below the flip is dangerous.” Distance matters.
If spot is only slightly above zero gamma, the market can move from a stabilizing regime to an amplifying regime quickly.
Treat the flip as a boundary, not a static prediction.
Call Wall
The call wall is usually the most important upside level on the board.
In normal conditions it behaves like resistance because hedging can add selling pressure as price approaches that strike.
But a call wall is not an impenetrable ceiling. If price pushes through with confirmation, especially in a short-gamma environment, the old wall can weaken and the next concentration can become the new focus.
The call wall becomes more useful when it is supported by more than one view.
A call wall backed by visible strike concentration, expiration concentration, and confirmation from signals or flow deserves more respect than a single isolated strike spike.
Put Wall
The put wall is the downside equivalent. It is commonly treated as structural support because put-side hedging pressure may add buying as price approaches that zone.
If price breaks below the put wall, the supportive effect can weaken quickly as the structure reprices.
The put wall becomes more meaningful when it lines up with open-interest concentration or a broader downside structure.
If the same level appears across GEX and OI views, treat it as a higher-quality support zone than a level that appears in only one model.
Peak GEX / Magnet Level
Peak GEX is the strike where absolute gamma concentration is highest.
On positive-gamma days, it can behave like a magnet because hedging flows dampen movement away from the zone.
On negative-gamma days, the magnet concept becomes less reliable because pro-cyclical hedging can make price travel away from levels faster.
A magnet level is strongest when it overlaps with another structural level, such as the call wall, peak GEX strike, or an obvious open-interest cluster.
The overlap matters more than the label. A single magnet signal is useful; a magnet that aligns with other structural evidence is more actionable.
The Expiration Trap: Why 0DTE Can Change the Whole Read
The most common GEX mistake is not misunderstanding gamma. It is misunderstanding which gamma matters.
Because gamma is highest near at-the-money and near expiration, 0DTE and the nearest weekly often dominate the intraday map while monthly and all-expirations views do a better job describing the broader ceiling and floor.
The shorter your holding period, the more weight you should give to the nearest active expiration.
How to Choose the Right Expiration View
| Trader intent | Best filter in InsiderFinance | Why |
|---|---|---|
| Intraday scalp | 0DTE first, then nearest weekly | You care about the most reactive gamma in the session |
| Standard day trade | 0DTE + nearest weekly, compared against all expirations | You need today’s map and the broader anchor |
| Short swing trade | Nearest weekly + monthly | Near-term structure matters, but same-day noise matters less |
| Position trade | All expirations + dominant monthly expiries | The broader positioning backdrop matters more |
| Event trade | Nearest active expiry + all expirations | You need both the local map and the broader frame |
The point is not to find one perfect expiration setting and ignore everything else. The point is to compare views deliberately.
If the nearest expiry and all-expirations map agree, confidence usually improves. If they conflict, your holding period should decide which view gets more weight.
A Trader’s Daily Gamma Exposure Workflow
Pre-Open
Before the bell, do five things:
- Check whether net GEX is positive or negative.
- Mark the gamma flip.
- Mark the call wall, put wall, and nearest peak GEX strike.
- Compare all expirations with 0DTE or the nearest weekly.
- Note whether an event or expiration could invalidate the map.
You are not looking for an entry yet. You are deciding whether the day is more likely to behave like a fade day, pin day, or momentum day.
First 30–60 Minutes
This is where you compare the pre-open map against the first real test of the session.
Watch whether price accepts above or below the gamma flip, whether it reacts to the walls the way the map suggests, and whether intraday changes are strengthening or weakening the levels.
- If price accepts above the flip, the stabilizing read becomes more credible.
- If price loses the flip and starts moving toward the put wall, the amplifying read deserves more respect.
Midday and Into the Close
In positive gamma, late breakouts usually deserve more skepticism. In negative gamma, clean wall breaks deserve more respect.
By the afternoon, the right question is not “what did the morning map say?” but “did the market confirm it?”
This is where intraday GEX change becomes more useful than a static morning read. A level that was important pre-open may weaken, strengthen, or migrate by midday.
The right question is not only where the wall is, but whether the wall is still being reinforced.
Event Day Behavior: FOMC, CPI, NFP, OPEX, and Earnings
GEX still matters on event days, but the way it matters changes.
On FOMC, CPI, and NFP days, GEX is usually more useful as a location map than an entry trigger.
The gamma flip, call wall, and put wall still matter, but the first reaction can rip through levels that would otherwise hold.
Once the release is digested, those levels can become useful again as post-event acceptance, rejection, and target zones.
On monthly OPEX, confidence should shift from “will the current wall hold?” to “how much of today’s map is about to roll off?”
GEX can shift meaningfully after large options expirations, especially monthly OpEx. That does not make GEX useless; it means the trader should expect migration and re-check levels after the roll.
On earnings, GEX can frame pre-event structure, but the gap can instantly reprice the chain.
For single stocks, the best use is usually after the event. Once the gap is known, implied volatility resets, and the new chain structure becomes visible.
| Event type | What GEX still helps with | What to de-prioritize |
|---|---|---|
| FOMC / CPI / NFP | Regime boundary, post-release targets, reaction zones | Blindly fading the first move |
| Monthly OPEX | Spotting level migration and resets after roll-off | Assuming yesterday’s walls survive unchanged |
| Single-stock earnings | Framing pre-event structure and post-gap reorientation | Expecting static levels to survive the gap |
GEX Across Asset Types
| Asset type | Where GEX tends to work best | Main caveat |
|---|---|---|
| SPX / SPY | Cleanest regime read and most durable structural levels | Macro catalysts can still overwhelm the map |
| QQQ / IWM and liquid ETFs | Strong short-term structure when the chain is dense | Levels can migrate faster during factor-driven moves |
| Large-cap single stocks | Useful outside earnings when weekly options are active | Company-specific news can reprice the chain quickly |
| Thin chains / low-OI names | Best treated as rough context only | Sparse positioning makes levels noisy |
The larger and more liquid the options market, the more likely hedging flows matter relative to the underlying’s normal trading activity.
That is why SPX/SPY-style products are the cleanest use case, and thin chains are the least reliable.
Single-stock GEX is most meaningful for names with large, liquid options markets, while smaller-cap names with thin options markets are less predictive.
The live SPY walkthrough below is a high-liquidity example, which makes it useful for teaching the workflow: all-expiration GEX, active-expiration structure, OI concentration, intraday GEX migration, signals, and squeeze context can all be reviewed in one sequence.
How to Use InsiderFinance Gamma Exposure Step by Step
Many public GEX dashboards stop at a static histogram. InsiderFinance is strongest when you use it as a workflow that combines structure, expiration control, sensitivity testing, positioning context, and intraday confirmation on one page.
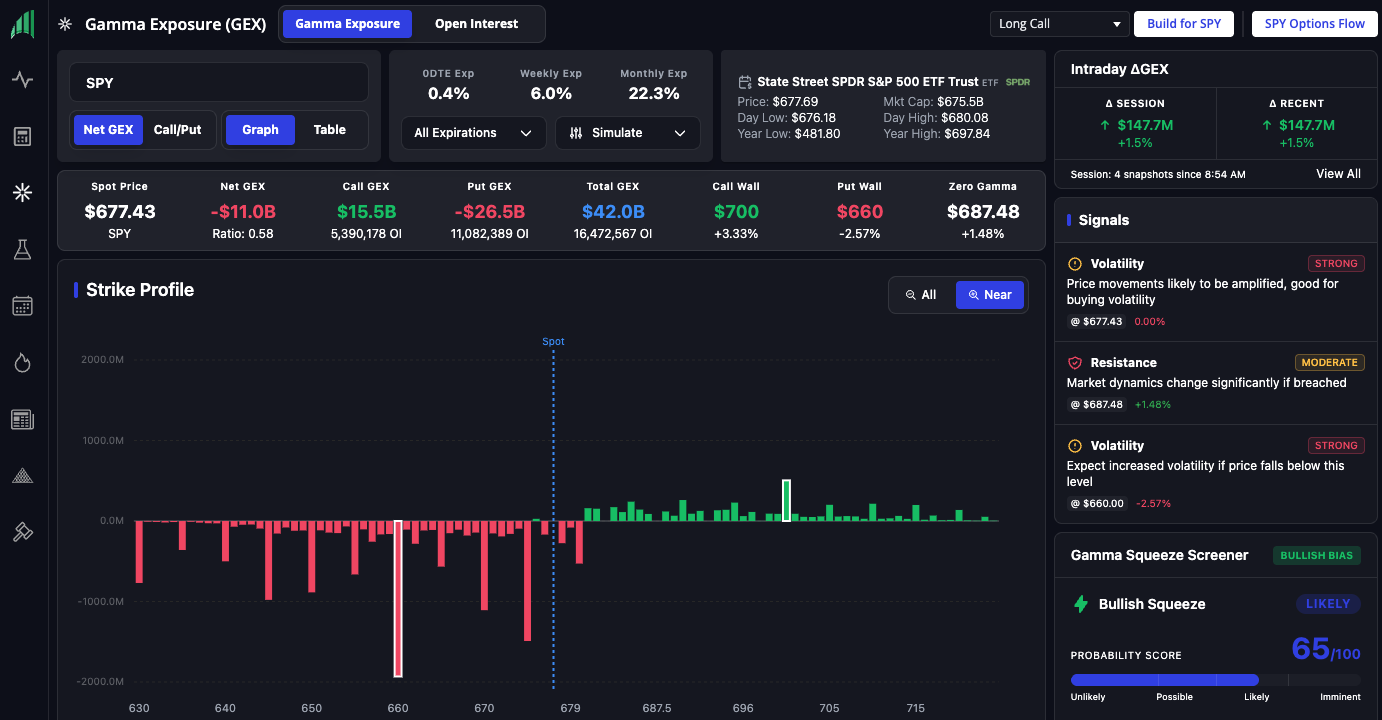
1) Start With the Summary Strip

Read the top summary first: spot price, net GEX, call GEX, put GEX, total GEX, call wall, put wall, and zero gamma. That gives you the regime and the nearest structural levels in one glance.
In the SPY screenshot, the summary strip showed:
| SPY dashboard metric | Value in screenshot | How to read it |
|---|---|---|
| Spot Price | $736.88 | Current reference price for the GEX map |
| Net GEX | $1.2B | Mildly positive aggregate regime at that moment |
| Call GEX | $21.0B | Large call-side contribution, with 5,613,716 call OI shown |
| Put GEX | -$19.7B | Large put-side contribution, with 12,325,973 put OI shown |
| Total GEX | $40.7B | Large total sensitivity, with 17,939,689 total OI shown |
| Call Wall | $740 | Nearby upside level, +0.42% from spot |
| Put Wall | $700 | Larger downside level, -5.00% from spot |
| Zero Gamma | $736.06 | Regime boundary, -0.11% from spot |
| 0DTE Exp | 0.1% | Same-day expiration contribution shown in the top exposure cards |
| Weekly Exp | 2.2% | Near-term weekly contribution shown in the top exposure cards |
| Monthly Exp | 5.0% | Monthly contribution shown in the top exposure cards |
The key read is not simply “net GEX is positive.” It is that net GEX was only modestly positive relative to a large total GEX base, while spot was sitting very close to zero gamma.
That makes the regime less comfortable than the green net number might imply. The map was actionable, but not static.
2) Toggle Net GEX and Call/Put

The Net GEX view answers the regime question. The Call/Put view answers the source question.
Start with net GEX to decide whether the environment is more mean-reverting or more momentum-prone, then switch to call/put to see whether the key structure is being driven by calls above spot, puts below spot, or both.
In the SPY example, the call and put sides were both large: $21.0B call GEX versus -$19.7B put GEX. That produced only $1.2B net GEX, even though total GEX was $40.7B.
This is exactly why the split matters. A trader who only reads net GEX may miss that the chain is carrying large offsetting sensitivity.
3) Compare All Expirations With the Active Expiration Window

Use the expiration filter to compare all expirations, 0DTE, nearest weekly, and any specific expiry you care about.
This is one of the highest-value actions on the page because it often changes the apparent call wall, put wall, and even the regime for short-term trading.
At this stage, you are identifying which expiration view deserves priority. The heatmap step below then shows whether the important strike is concentrated in one expiration or repeated across several expirations.
That distinction is difficult to see from a one-dimensional strike chart alone.
4) Switch Between Graph and Table

The Graph view is better for shape recognition: clustering, asymmetry, and whether a level is isolated or part of a broader band.

The Table view is better for exact strikes, exact values, and sorting.
The graph answers what matters; the table answers how much it matters relative to the next level.
Use the heatmap as the third lens after graph and table. The graph shows shape by strike. The table gives exact values. The heatmap shows whether those values are driven by a specific expiration or repeated across the chain.
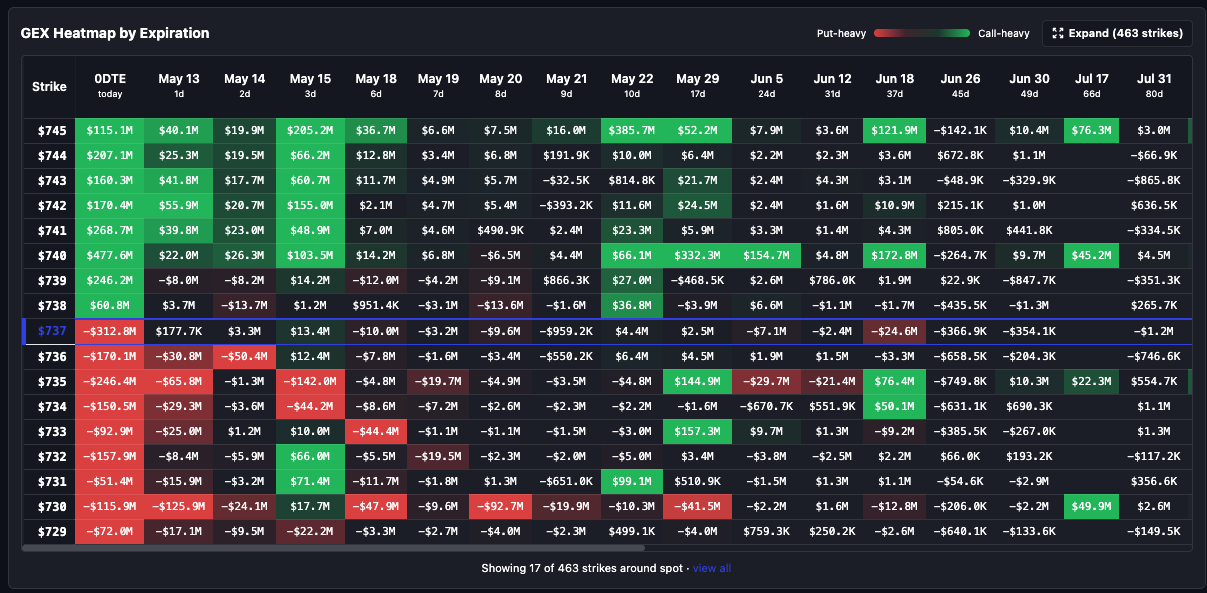
5) Read the GEX Heatmap by Expiration
The GEX Heatmap by Expiration is the fastest way to see whether gamma concentration is clustered by price, expiration, or both.
Instead of viewing only aggregate GEX by strike or aggregate GEX by expiration, the heatmap shows the intersection of the two.
In InsiderFinance, the heatmap is a two-dimensional matrix:
- Rows: option strikes
- Columns: expiration dates
- Each cell: net GEX for that specific strike and expiration pair
- Green cells: positive / call-heavy gamma exposure
- Red cells: negative / put-heavy gamma exposure
- Color intensity: larger absolute GEX values show stronger color
- Cell tooltip detail: strike, expiration, net GEX, call GEX plus call open interest, and put GEX plus put open interest
The compact view centers strikes around the current spot price. This matters because traders usually care most about the nearest cluster first, not every far-out strike in the chain.
Around spot, the 0DTE column showed strongly negative exposure at $737 (-$312.8M), $736 (-$170.1M), $735 (-$246.4M), $734 (-$150.5M), $733 (-$92.9M), $732 (-$157.9M), and $730 (-$115.9M).
But immediately above spot, the same 0DTE column shifted positive: $738 +$60.8M, $739 +$246.2M, $740 +$477.6M, $741 +$268.7M, and $742 +$170.4M.
That is the type of live structure a one-dimensional chart can hide. The heatmap shows a sharp transition around spot: negative 0DTE gamma below and at the highlighted $737 row, then heavy positive 0DTE gamma above it.
The second read is whether a level is isolated or repeated across expirations. In this SPY example, $740 was not just one isolated 0DTE cell. It also showed positive GEX across multiple future expirations, including May 15 (+$103.5M), May 22 (+$66.1M), May 29 (+$332.3M), Jun 5 (+$154.7M), and Jun 18 (+$172.8M).
That helps explain why $740 also appeared elsewhere in the dashboard as both the call wall and a strong magnet. The heatmap’s value is simple: it shows whether a key level is merely a same-day artifact or a repeated zone across the chain.
That helps explains why $740 appeared elsewhere in the dashboard as both the call wall and a strong magnet.
The heatmap’s value is simple: it shows whether a key level is merely a same-day artifact or a repeated zone across the chain.
6) Read the Expiration Breakdown and Gamma Price Profile

Use Gamma Exposure by Expiry to see which expirations are driving the structure, then use Gamma Price Profile to see how net gamma changes if spot relocates. That second view matters because it tells you whether a move is likely to keep the same regime or flip it.
This matters most when price is close to zero gamma. If price drifts below the flip, the trader should not keep using the same regime assumptions from the prior read.
The summary screenshot showed spot only $0.82 above zero gamma ($736.88 versus $736.06). That is exactly when the price profile matters.
If price drifts below the flip, the trader should not keep using the same regime assumptions from the prior read.
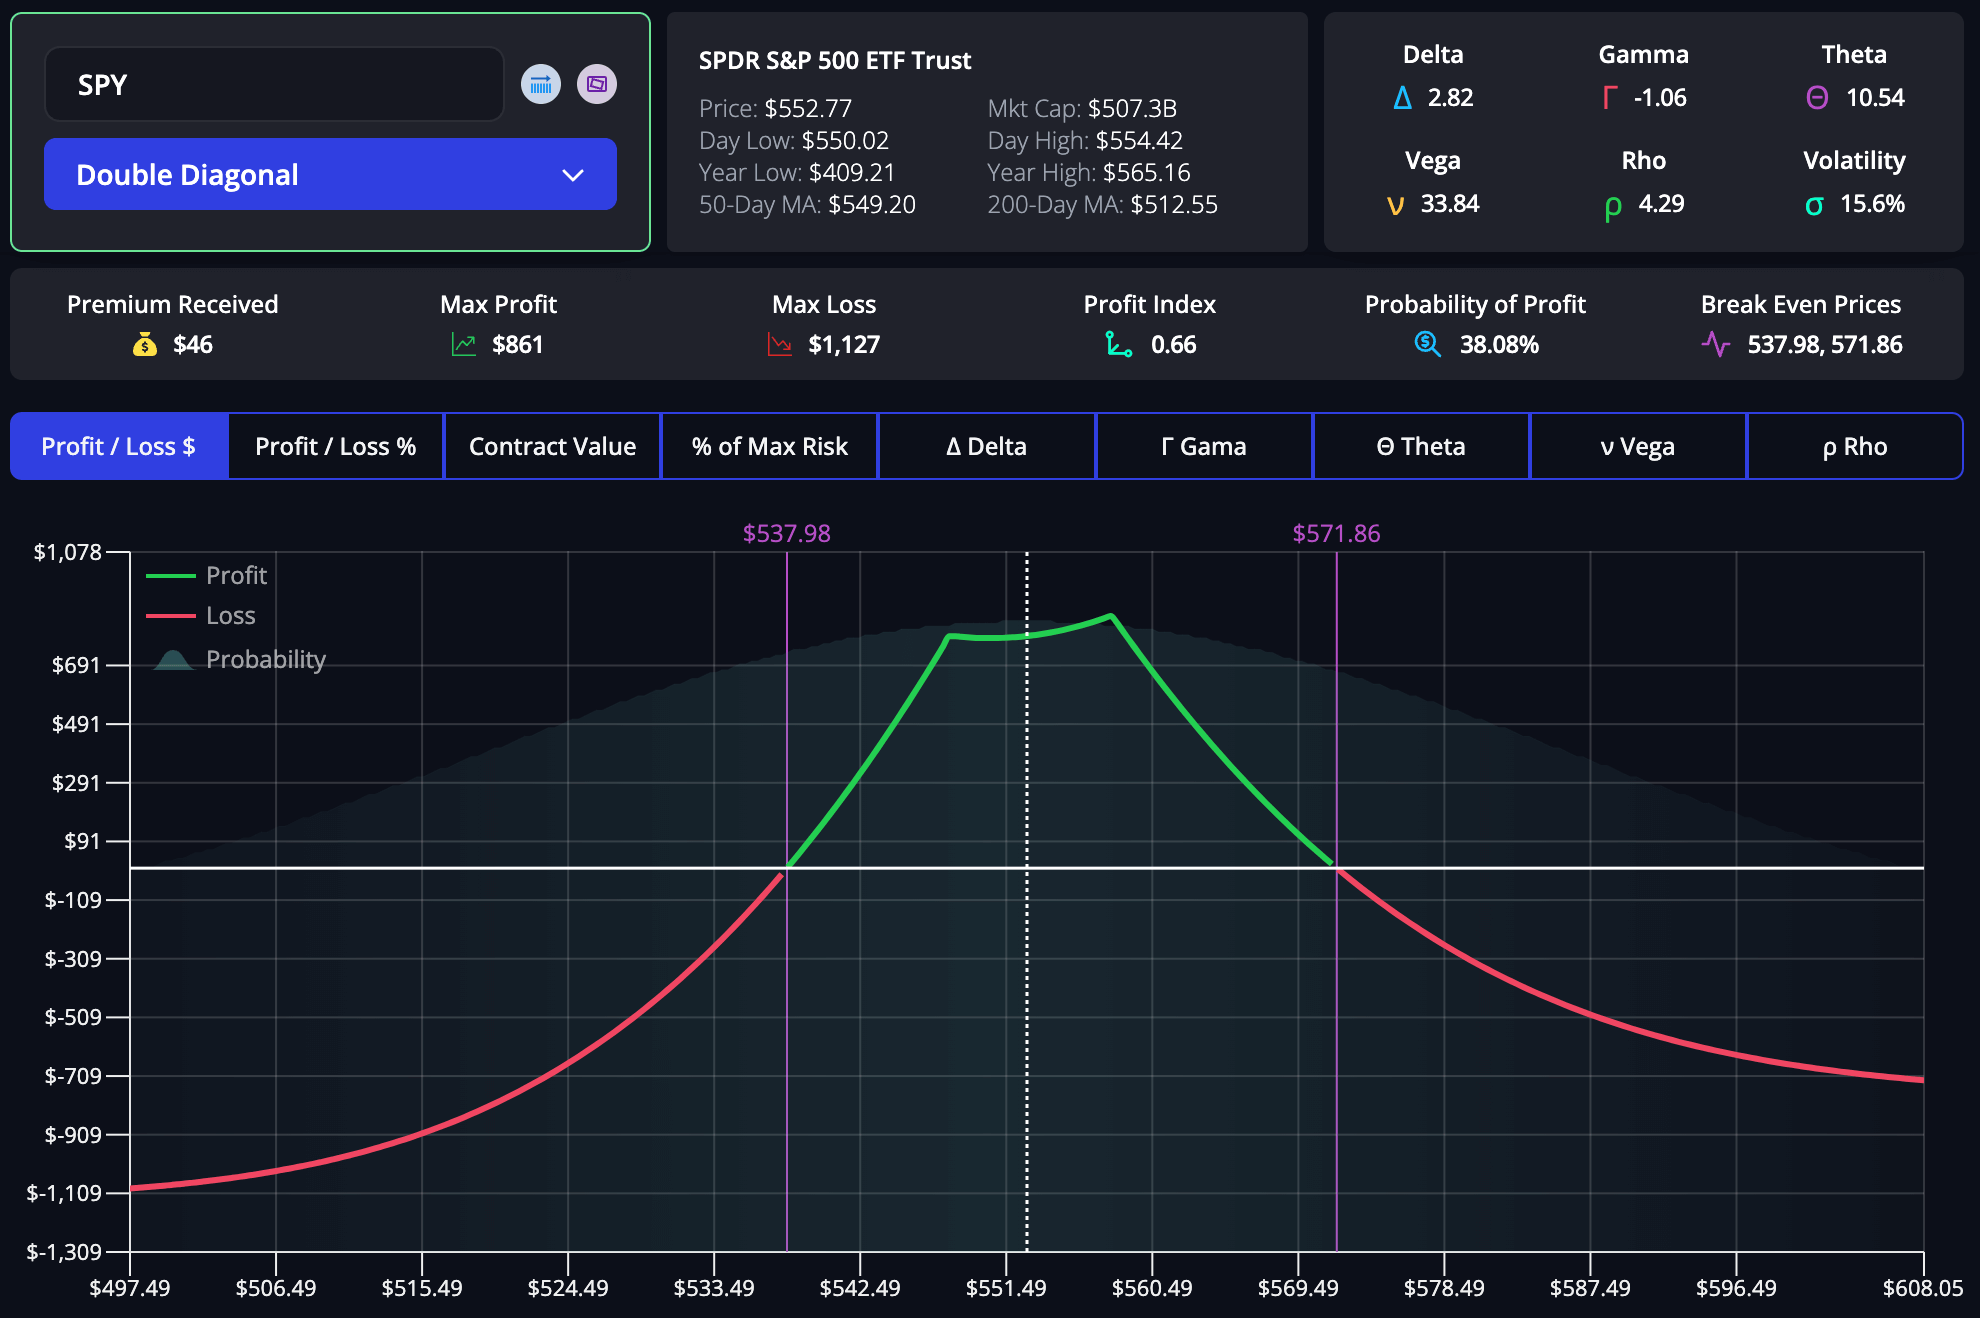
7) Stress-Test the Map With the IV Simulation Slider

This is one of the rarest features in the workflow. InsiderFinance lets you run an implied-volatility simulation from -50% to +50% and re-check the gamma outputs.
Used correctly, this is not a forecasting toy. It is sensitivity testing.
Many public GEX tools do not let you ask the most useful question: if IV changes, do the important levels still survive?
A level that disappears under a modest IV change deserves less confidence than one that stays intact.
The SPY simulation screenshot shows the slider active at +21% IV adjustment. With that adjustment active, the dashboard displayed 0DTE Exp 0.1%, Weekly Exp 3.2%, and Monthly Exp 6.8%.
This is useful because, as the Options Industry Council notes, IV changes can affect gamma, with low-IV at-the-money options often showing more dramatic delta changes and high-IV options generally showing less delta change from the same underlying move.
The trading use is simple: if your whole thesis depends on one wall and that wall is fragile under a reasonable IV change, reduce confidence.
If the same wall remains visible after the simulation, treat it as a more durable structural level.
8) Use the Embedded Open-Interest Views Without Leaving the Page

This is the second major workflow edge.
Many traders are forced into a two-dashboard routine: one page for GEX, another for OI.
InsiderFinance collapses that friction by embedding open-interest analysis directly into the same research workflow.
The OI screenshot showed SPY with:
| OI metric | Value in screenshot | Interpretation |
|---|---|---|
| Total OI | 17.9M | Large total options positioning base |
| Call OI | 5.6M | Call-side open interest |
| Put OI | 12.3M | Put-side open interest |
| Net OI | -6.7M | Put-heavy aggregate OI |
| C/P Ratio | 0.46 | Calls relative to puts |
| PCR | 2.19 | Put/call ratio shows put-heavy positioning |
| Max Pain | $710.00 | Expiration-oriented reference level |
| High OI | $700.00 | Largest OI concentration in the displayed summary |
This view changes how a trader reads the GEX map.
The GEX summary showed a $700 put wall, and the OI page showed High OI at $700.00.
That alignment makes the $700 level more relevant than it would be if it appeared only in one model.
The OI strike profile also showed dense red put-side positioning below spot and green call-side positioning above spot, with the spot marker near $737.
InsiderFinance’s open-interest dashboard can support several OI views in the same broader workflow, including strike profile, volume profile, expiry breakdown, strike ladder, and cumulative profile.
That matters because it eliminates a common two-dashboard workflow: traders do not have to inspect GEX in one tool, then manually reconstruct OI context somewhere else.
9) Watch the Intraday Δ Session / Δ Recent Tracker
, Δ Recent up $287.1M (+18.4%), and 9 snapshots since 9:10 AM.")
Static GEX is useful. Changing GEX is better.
The Δ Session and Δ Recent tracker answers the question many public GEX pages do not answer well: is this level strengthening, weakening, or migrating right now?
The SPY intraday screenshot showed an especially useful tension:
- Δ Session: down $2.5B, or -204.1%
- Δ Recent: up $287.1M, or +18.4%
- Session history: 9 snapshots since 9:10 AM
That means the session-level GEX structure had deteriorated materially, but the most recent snapshot improved.
A trader should not flatten that into a single bullish or bearish label. The better read is: the broader session had weakened, but the last update was moving in a more stabilizing direction.
That is exactly the kind of nuance static end-of-day dashboards miss.
This also explains why the screenshots can show different regimes at different moments.
One screenshot showed Net GEX +$1.2B near $736.88; the squeeze screener later referenced a short gamma environment (-$1.3B net GEX) near $736.27.
That is not a contradiction to ignore. It is the point of using intraday change data. The map can migrate.
10) Use Recent Flow, Signals, and the Gamma Squeeze Screener as Confirmation Layers

This is the third major workflow edge. InsiderFinance does not stop at the map; it gives you confirmation context on the same page.
The SPY Signals screenshot showed four actionable context cards:
| Signal | Strength | Level | What it said |
|---|---|---|---|
| Volatility | Strong | $736.27 | Price movements likely to be amplified; good for buying volatility |
| Support | Moderate | $734.80 | Market dynamics change significantly if breached |
| Magnet | Strong | $740.00 | Price likely to gravitate toward this level |
| Volatility | Strong | $700.00 | Expect increased volatility if price falls below this level |
That gives the trader a clean map: spot around $736.27, support/trigger around $734.80, magnet/call wall around $740.00, and a larger downside volatility level around $700.00.

The Gamma Squeeze Screener then turned that structure into a confirmation-aware setup read. In the SPY screenshot, it showed:
- Bias: Bullish Bias
- Setup: Bullish Squeeze
- Status: Likely
- Probability Score: 70/100
- Gamma Regime: 25
- Call Wall Proximity: 25
- Flow Alignment: 10
- Volume Confirm: 5
- DEX Bias: 5
- Current Price: $736.27
- Call Wall: $740.00 (+0.51%)
- Trigger Level: $734.80
The setup analysis stated: Short Gamma Environment (-$1.3B net GEX), Call Wall at $740.00, Neutral flow (bullish flow would strengthen), and Awaiting volume confirmation.
The trading implication was: bullish squeeze conditions developing; watch for bullish flow continuation and price approaching $740.00.
That is the right way to use a screener. It should not replace the structural map. It should tell you whether the structure has enough confirmation to matter.
11) Only Then Build the Trade
The sequence matters:
- Define the regime.
- Mark the gamma flip, call wall, put wall, and nearest concentration.
- Compare all expirations with the active near-term window.
- Read the heatmap by strike and expiration.
- Stress-test important levels with IV simulation.
- Confirm with OI, intraday changes, signals, and options flow.
- Only then choose the strategy.
Structure first. Confirmation second. Execution third.
In the SPY example, the clean practical read was: spot was near the gamma flip, $740 was the key nearby upside wall/magnet, $734.80 was an important support/trigger level, $700 was the larger downside put wall/high-OI level, and intraday GEX was migrating enough that a trader should monitor updates rather than rely on a static pre-open view.
When Gamma Exposure Works Best — and When It Fails
| Environment | Reliability of GEX read | Why |
|---|---|---|
| Liquid index / ETF with heavy options activity | High | Dense positioning and cleaner hedging response make levels more meaningful |
| Large-cap stock with active weeklies | Medium to high | Strong structure can matter, but company-specific catalysts can override it |
| Single stock near earnings | Lower | Volatility repricing and gap risk can overwhelm static levels |
| Illiquid options chain | Lower | Sparse positioning makes the map less stable and more prone to noise |
| Macro event day | Lower at event time | Structural levels may matter before and after the event, but can fail violently during the release |
GEX usually works best when the underlying is liquid, the chain is dense, the relevant expiration window is clear, and the day does not have overwhelming event risk.
It works worst when traders ignore liquidity, ignore catalysts, or confuse a modeled level with a law of physics.
The SPY example is a high-quality use case because SPY has dense options activity and multiple relevant expirations.
But even in SPY, the screenshots show why GEX should be dynamic: net GEX can shift, the heatmap can reveal expiration-specific concentrations, and the intraday tracker can show whether the map is strengthening or weakening.
Gamma Exposure vs Open Interest vs Gamma Squeeze vs Max Pain
| Concept | What it is | What it is best used for |
|---|---|---|
| Gamma Exposure (GEX) | Estimate of how hedging sensitivity changes as price moves | Regime + key level mapping |
| Open Interest (OI) | Number of outstanding option contracts | Positioning density |
| Gamma Squeeze | A potential feedback loop where hedging amplifies the move | Instability / acceleration conditions |
| Max Pain | A settlement-oriented framework around where option buyers lose the most | Context only; not a substitute for GEX |
Open interest tells you where contracts exist. GEX tells you how mechanically important those contracts may become as the underlying moves.
A gamma squeeze is not the same thing as negative GEX; it is a possible outcome when short-gamma conditions get confirmation.
Max pain is a separate expiration framework and can be interesting context, but it is not a substitute for a live hedging map.
The SPY screenshots show the distinction cleanly.
GEX identified a $740 call wall, $700 put wall, and $736.06 zero-gamma level.
OI showed Max Pain at $710 and High OI at $700.
Signals showed $740 as a strong magnet and $734.80 as a moderate support/trigger level.
The squeeze screener showed whether those ingredients were turning into an acceleration setup.
Common Gamma Exposure Mistakes
1) Treating GEX as a prediction engine
GEX is a structure map, not a crystal ball. The SPY example did not say price “must” go to $740.
It showed that $740 was a meaningful wall/magnet zone that required confirmation.
2) Using only the all-expirations view
The broad map is useful, but today’s real battleground may live almost entirely in 0DTE or the nearest weekly chain.
The heatmap exists to solve exactly this problem.
3) Ignoring units and model assumptions
Different tools use different defaults, and public GEX is modeled from visible options data rather than a clean dealer-inventory feed.
Spreads, overwrites, structured products, and unrevealed institutional positions can blur the simple call/put exposure read.
Compare structure first and raw magnitude second.
4) Trading exact strikes instead of zones
The most relevant levels are usually clusters, not knife-edge numbers.
In the SPY heatmap, the key upside structure was not just one $740 cell; it was a nearby zone with visible positive GEX from roughly $738 to $742 in the 0DTE column and repeated $740 strength across several expirations.
5) Confusing positive gamma with bullishness
Positive gamma does not mean the market must go up. It means hedging is more likely to suppress volatility.
Negative gamma does not mean the market must go down. It means moves can be amplified.
6) Forgetting that walls move
A wall can migrate quickly once price breaks through and the chain reprices.
7) Using static data in a dynamic market
Large expirations, large price moves, IV shifts, and intraday flow changes can all change the map.
The SPY intraday tracker showing Δ Session -$2.5B is the exact kind of change a static chart would miss.
8) Expecting GEX to work the same way on every ticker
Index products and liquid ETFs usually give cleaner reads than thin single stocks.
Put the GEX Map to Work
Gamma exposure becomes powerful when the pieces line up.
A level is more useful when it appears in the strike profile, survives the expiration filter, shows up in the heatmap, agrees with open interest, and is supported by intraday change or flow confirmation.
That is the difference between staring at a static options chart and using GEX as a real trading workflow.
To keep going, read The Ultimate Guide to Gamma Exposure (GEX) for the full foundation, then open InsiderFinance Gamma Exposure and run the sequence on SPY or your own ticker.
The goal is not to force trades from GEX. The goal is to know when market structure supports your trade, when it contradicts your trade, and when the smartest move is to wait.
HIGH POTENTIAL TRADES SENT DIRECTLY TO YOUR INBOX
Add your email to receive our free daily newsletter. No spam, unsubscribe anytime.
FAQs
What is Gamma Exposure in Options Trading?
Gamma exposure, or GEX, is an estimate of how much dealer hedging demand may change as the underlying moves. It aggregates gamma across strikes and expirations, usually with open interest as a proxy for positioning. Traders use it to identify volatility regime, key support and resistance levels, and where hedging flows may matter most.
Is Gamma Exposure Bullish Or Bearish?
By itself, gamma exposure is neither bullish nor bearish. It is better understood as a volatility-regime metric. Positive gamma usually supports calmer, more mean-reverting behavior, while negative gamma usually supports faster, more momentum-driven behavior. Direction still requires confirmation from price action, flow, catalyst context, and the broader market tape.
What Does Positive Gamma Exposure Mean?
Positive gamma exposure usually means dealer hedging is more likely to be counter-cyclical: selling strength and buying weakness. That can dampen realized volatility, encourage range behavior, and make magnet levels more useful. It does not mean price must rise. It means moves are more likely to be absorbed unless a catalyst overwhelms the structure.
What Does Negative Gamma Exposure Mean?
Negative gamma exposure usually means dealer hedging is more likely to be pro-cyclical: buying strength and selling weakness. That can amplify moves, widen intraday ranges, and make wall breaks more important. It does not mean price must fall. It means price movement can travel farther once momentum starts.
What Is the Gamma Flip Or Zero-Gamma Level?
The gamma flip, or zero-gamma level, is the price where aggregate net gamma changes sign. Above it, the market is usually in a more stabilizing regime; below it, a more unstable one. When spot is close to the flip, small moves can change the whole GEX read.
What’s the Difference Between Gamma Exposure And Dealer Gamma?
“Dealer gamma” usually refers to the aggregate gamma inventory of market makers or dealers. “Gamma exposure” is the trader-facing estimate of how that inventory may translate into hedging demand across strikes and expirations. Public GEX is modeled from visible options data, not directly reported dealer books.
What Is The Call Wall?
The call wall is the strike with the strongest call-side gamma concentration and is often treated as the market’s key upside resistance or magnet zone. In the SPY screenshot, the call wall was $740, which also appeared as a strong magnet in the signal panel.
What Is the Put Wall?
The put wall is the strike with the strongest put-side gamma concentration and is often treated as the market’s key downside support level. In the SPY screenshot, the put wall was $700, and the OI dashboard also showed High OI at $700, reinforcing that level’s importance.
Why Do Different Gamma Exposure Tools Show Different Numbers?
Different tools can use different expiration filters, units, data-refresh timing, and dealer-positioning assumptions. One dashboard may show GEX per 1% move, another may use a different aggregation window, and another may emphasize nearby expirations. Compare level structure first and raw magnitude second.
Is Gamma Exposure the Same as Open Interest?
No. Open interest is the number of outstanding option contracts. Gamma exposure estimates how sensitive those contracts may become to price movement. In the SPY example, OI showed 17.9M total OI and High OI at $700, while GEX showed a $740 call wall, $700 put wall, and $736.06 zero gamma.
Does Gamma Exposure Matter for 0DTE Trading?
Yes. Gamma is typically highest near the money and near expiration, which makes same-day expirations especially important for intraday structure. Cboe reported that SPX 0DTE options averaged 59% of total SPX volume in 2025 and reached 62.4% in August 2025.
Can Gamma Exposure Predict a Gamma Squeeze?
Not on its own. GEX can identify the structural conditions that make a squeeze more possible, especially when net gamma is negative, but price, flow, and volume still need to confirm the move. In the SPY screenshot, the screener showed Bullish Squeeze Likely, 70/100, but still flagged neutral flow and awaiting volume confirmation.
Does Gamma Exposure Work for Individual Stocks?
Yes, but confidence should vary by ticker. GEX is generally more reliable in liquid large-cap names with active weekly options and less reliable in thin chains or around earnings. Company-specific catalysts can reprice a single-stock options chain much faster than an index or ETF chain.
How Often Should I Check Gamma Exposure During the Trading Day?
At minimum, check it before the open, after the first 30–60 minutes, and again if price approaches the gamma flip, call wall, put wall, or a major signal level. On heavy 0DTE or event days, check it more often because intraday GEX can migrate quickly.
What’s the Difference Between Gamma Exposure and Max Pain?
Max pain is an expiration-oriented framework based on where option buyers would lose the most at settlement. Gamma exposure is a market-structure framework tied to hedging sensitivity. Max pain can be useful context, but it is not a substitute for a live GEX map. In the SPY example, max pain was $710, while the live call wall was $740.
Can I Use Gamma Exposure for Swing Trading?
Yes, but use the right expiration view. For swing trading, put less weight on 0DTE and more weight on the nearest weekly, monthly, and all-expiration structure. The longer your holding period, the more the broader chain matters and the less useful same-day gamma noise becomes.
What Is the GEX Heatmap by Expiration?
The GEX heatmap by expiration shows net gamma exposure at each strike-and-expiration intersection. Rows are strikes, columns are expirations, and each cell shows net GEX for that pair. In the SPY screenshot, the heatmap showed $740 positive across multiple expirations and strong negative 0DTE exposure around $737–$735, making the near-spot structure much easier to read.
How Should Beginners Use Gamma Exposure?
Keep it simple: check whether net GEX is positive or negative, mark the gamma flip, call wall, and put wall, compare all expirations with the nearest active expiry, and then use OI plus recent flow for confirmation. Do not treat any single level as guaranteed. GEX is a decision-support framework, not a standalone trading system.