The Ultimate Guide to Gamma Exposure (GEX)
Gamma exposure (GEX) is an estimate of how dealer hedging flows may affect price as the underlying moves. Traders use it to answer two practical questions:
- Whether hedging is more likely to dampen volatility or amplify it
- Which strike levels are most likely to matter intraday
The real edge in gamma exposure does not come from the headline number alone. It comes from combining regime, key strike levels, expiration concentration, and intraday context.
That is why traders focus on concepts like positive gamma, negative gamma, the gamma flip, and 0DTE concentration.
What Gamma Exposure Is
Gamma is the rate of change of delta. In the Cboe Global Markets glossary, gamma is defined as measuring the change in delta for a $1 change in the underlying price.
Gamma exposure builds on that idea by aggregating gamma across a whole option chain (many strikes and expirations) and then weighting it by positioning (typically via open interest). The goal is to estimate where and how strongly hedging flows could appear as price moves.
Two core distinctions matter:
Gamma (single option):
- Gamma describes how one option’s hedge ratio (delta) changes as the underlying changes. Gamma is typically highest near-the-money and near expiration.
Gamma exposure (chain/market structure):
- Gamma exposure estimates how aggregate delta-hedging needs could change across strikes/expirations as the underlying moves, often interpreted as a map of potential mechanical buying/selling pressure.
A quick but important risk note: options are leveraged derivatives and can produce significant losses; treat any “GEX level” as market-structure context, not a guarantee.
Why Gamma Exposure Influences Price Action
To understand why GEX matters, you need the basic behavior of market makers. A “market maker” is defined (again in the Cboe glossary) as an exchange member who “make[s] markets” by actively quoting two-sided markets, creating liquidity and depth.
In many products, market makers and dealers hedge options risk dynamically. A delta-neutral position must be adjusted as delta changes, and the size of delta’s change is predicted by gamma, meaning gamma creates ongoing hedging demand.
Academic evidence supports the basic “stabilize vs amplify” intuition:
- In the Journal of Financial Economics, Baltussen, Da, Lammers, and Martens describe that hedging short gamma exposure requires trading in the direction of price movements, which can create intraday momentum.
- In an open-access simulation paper in the Journal of Economic Dynamics and Control, Buis et al. find that higher net gamma positioning of dynamic hedgers reduces volatility and increases market stability, while negative gamma positioning increases volatility and makes markets more prone to failure.
Positive Gamma Vs Negative Gamma
Industry tools commonly phrase this as a regime: “positive net gamma” (dealers long gamma) versus “negative net gamma” (dealers short gamma).
A practical interpretation, consistent across multiple references, is:
- Dealers long gamma → hedge by selling into rallies and buying dips, dampening movement.
- Dealers short gamma → hedge by buying into rallies and selling dips, reinforcing moves.
This “hedging direction flip” is exactly why traders obsess over where net gamma changes sign (often called the “gamma flip”).
Why This Got More Important with 0DTE
Gamma becomes extremely sensitive near expiration. The U.S. comptroller’s derivatives handbook notes gamma tends to be highest when an option is at-the-money and near or at expiration and even states that as time to maturity decreases, the gamma of an at-the-money option approaches infinity.
0DTE (same-day expiry) concentrates that sensitivity into the trading session.
And 0DTE is now structurally meaningful: Cboe Global Markets reports that 59% of SPX volume traded 0DTE.
How Gamma Exposure Is Calculated
There is no single universally “official” GEX formula: vendors differ by assumptions, data sources, and which expirations they include. That said, most chain-level approaches share the same backbone: option gamma × positioning × price scaling.
A Commonly Used Per-Strike Approximation
There is no single official GEX formula used by every platform. Most implementations use the same basic idea:
Gamma exposure per strike ≈ Gamma × Open Interest × Contract Multiplier × Spot² × 0.01
The exact units can differ by platform. Some tools show exposure per 1% move, others per $1 move, and others in normalized or notional terms.
The key idea is the same: strikes with high open interest, high gamma, and little time to expiration tend to matter most.
Net Vs Total Gamma Exposure
Most trading dashboards show both:
- Total GEX: total call + put gamma exposure magnitude (how much hedging “could exist” overall).
- Net GEX: call exposure minus put exposure (a proxy for the direction of the hedging regime: stabilizing vs amplifying).
What Inputs Matter Most
Open interest is a key input: FINRA defines open interest as the number of outstanding contracts, which can be broken down by puts/calls, strike, and expiration.
But the weighting matters because gamma itself changes sharply with moneyness and time:
- Gamma is higher at-the-money and closer to expiration.
- Implied volatility also affects gamma (Options Education notes that IV changes affect gamma: lower IV increases ATM gamma, and higher IV decreases it).
Why Different Platforms Disagree on “the” GEX Number
Three modeling issues explain most discrepancies:
- Open interest is a snapshot (typically updated end-of-day), while intraday trading can shift exposure before it shows up in OI.
- Dealer-vs-customer positioning is not directly observable from public chain data; many models must assume which side dealers are on.
- Which expirations are included (0DTE only, weeklies, monthlies, or the full surface) changes results materially, especially now that 0DTE dominates SPX volume.
HIGH POTENTIAL TRADES SENT DIRECTLY TO YOUR INBOX
Add your email to receive our free daily newsletter. No spam, unsubscribe anytime.
How Traders Use Gamma Exposure
Gamma exposure is most useful as market-structure context (like volatility “terrain”), not as a stand-alone entry signal.
Regime Framing
A clean, decision-grade way to use GEX is to start with regime:
| Regime | Typical dealer hedge behavior | What it often looks like intraday | What traders typically adjust |
|---|---|---|---|
| Net positive gamma | sell rips, buy dips (counter-cyclical) | tighter ranges, more mean reversion | fade extremes more often; reduce breakout-chasing; treat highs / lows as less likely to cascade |
| Net negative gamma | buy rips, sell dips (pro-cyclical) | wider ranges, momentum / cascading moves | respect breakouts / breakdowns more; tighten risk; expect faster tape and higher realized vol |
This framing aligns with both academic evidence (short-gamma hedging creates momentum) and industry descriptions used by major analytics tools.
Key Levels Traders Watch
Most GEX workflows focus less on the “total net number” and more on where exposure clusters by strike. Those clusters are commonly interpreted as potential support/resistance zones because hedging flows can concentrate there.
Common labels you’ll see:
- Gamma flip (zero gamma): the price level where net gamma crosses from positive to negative (or vice versa).
- Call wall / put wall: strikes with the greatest call-side or put-side gamma concentration, often treated as a ceiling/floor in that expiry window.
The terminology varies by platform, but the structural idea is consistent: hedging needs are not uniform across price; they spike near certain strikes/expirations.
Example: How Traders Read a Gamma Map
Suppose an index ETF is trading at 510.
- The largest positive gamma cluster sits at 515.
- The gamma flip sits at 507.
- The largest put-side concentration sits at 505.
- Most of the exposure is concentrated in 0DTE and the nearest weekly expiration.
A common interpretation would look like this:
- Above 507, hedging flows are more likely to dampen movement.
- Near 515, traders may expect more resistance or “pinning” behavior if price drifts into that strike.
- Near 505, traders watch for support to either hold or fail, depending on whether the price is still in a positive-gamma or negative-gamma regime.
- If price breaks below 507 and stays there, traders become more alert to faster, more directional movement because hedging can shift from counter-cyclical to pro-cyclical.
This is not a prediction. It is a way to frame where hedging pressure may matter most and how the market’s behavior can change as price moves between key levels.
A Practical Workflow Traders Use
A high-signal workflow (that avoids over-interpreting GEX) tends to look like this:
- First, identify the expirations that matter today (often 0DTE and the nearest weekly), because gamma is stronger when closer to expiry.
- Second, locate the highest exposure strikes and ask: If price moves toward this strike, would dealer hedging likely lean with the move or against it?
- Third, use GEX as a filter with other signals (trend, volatility regime, order flow). Most tools explicitly caution against relying on a single tool in isolation.
Limitations and Common Mistakes
If you want gamma exposure to be useful (instead of misleading), you need to be explicit about what it does not tell you.
GEX Is Modeled, Not Observed
Public option chains show strikes, greeks, volume, and open interest, but they do not reveal, contract-by-contract, whether dealers are net long or short each option position. Models must assume this (sometimes reasonably, sometimes not).
In other words, two platforms can both be “doing GEX,” and still disagree on sign/levels because their positioning assumptions differ.
Open Interest Timing Can Be a Trap
Open interest is an outstanding-contract count and is often treated as “positioning.”
But it’s also a snapshot that can lag what happened intraday, especially in heavy 0DTE environments where contracts open and die the same day and therefore may not accumulate into large OI.
Don’t Confuse “Gamma Is High” with “Price Must Pin”
Higher net positive gamma is associated with more stability and reduced volatility in both modeling and research, but that’s not a deterministic pinning machine. News shocks, macro prints, and liquidity gaps can overwhelm hedging flows.
Units and Scaling Matter
Some dashboards express GEX as “per 1% move,” others “per $1 move,” others in notional dollars, and others in normalized units. Always confirm what the y-axis represents, especially when comparing across tickers or tools.
How to Use InsiderFinance to Analyze Gamma Exposure
InsiderFinance GEX is most useful when you already understand the core GEX concepts and want to apply them to a real ticker.
The screenshots below use SPY as a live example, but the same process applies to any liquid options ticker and shows how traders can move from a raw gamma map to a more complete view of positioning, expiration structure, and intraday context.
Workflow
1. Load the ticker (index, ETF, or single stock)
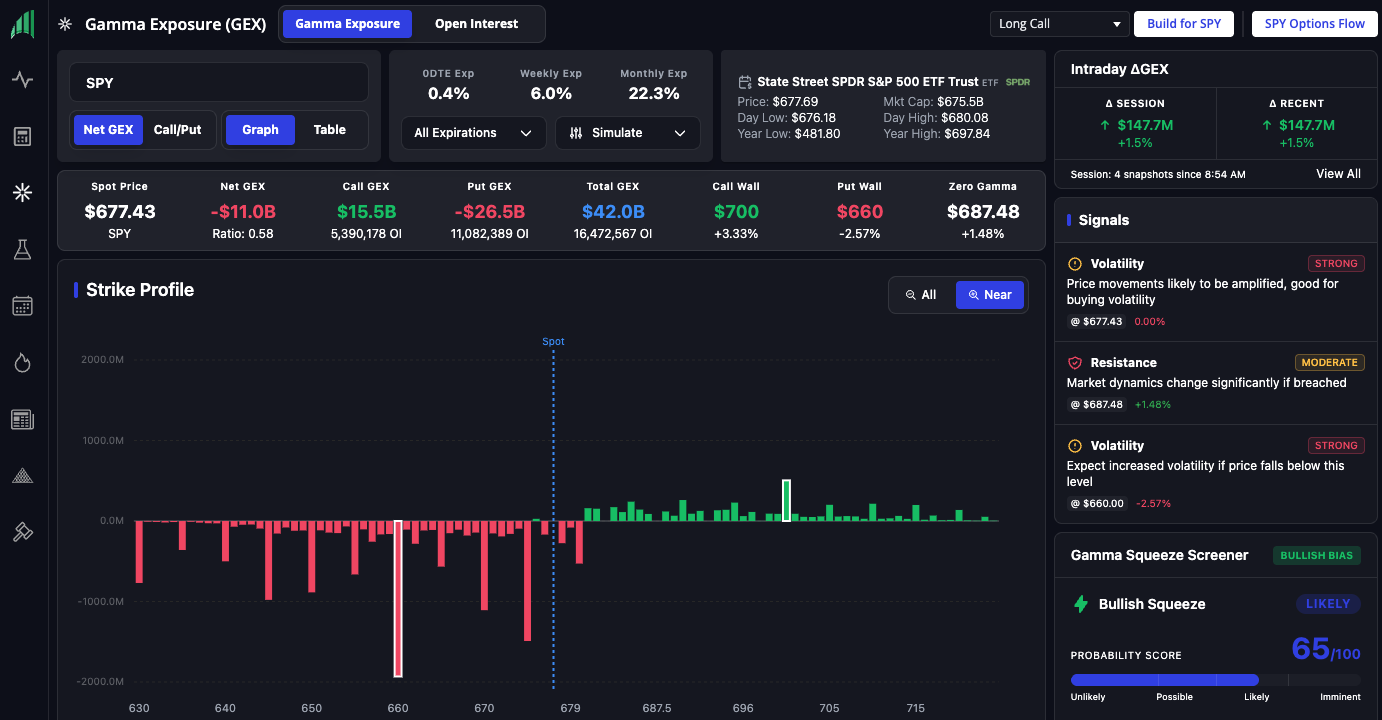
Start with the main Gamma Exposure overview so you can identify the most important levels before drilling into details.
- In the SPY example, spot is $677.43, the call wall is $700, the put wall is $660, and zero gamma is $687.48.
- A good first read is simple: SPY is trading between the put wall and the call wall, with the zero-gamma level sitting above the current price.
- That immediately gives you a working map of the session: $660 matters on the downside, $687.48 is the regime pivot, and $700 is the major overhead level.
- Use the Near zoom on the strike profile when you want to focus on the strikes closest to spot instead of the full chain.
2. Check the regime
Use Net GEX first to determine whether the structure is more likely to dampen moves or amplify them.
- In the overview screenshot, Net GEX is -$11.0B, with Call GEX at $15.5B and Put GEX at -$26.5B.
- That combination suggests a negative-gamma regime, which generally means dealer hedging is more likely to amplify price movements rather than absorb them.
- Spot is also below zero gamma ($687.48) in this snapshot, which reinforces the idea that the market is in a more fragile regime.
- The right-side signal panel supports this read by flagging volatility and identifying $687.48 as a level where market dynamics could change materially if breached.
3. Split calls and puts
Switch to Call/Put view so you can see where call gamma and put gamma are concentrated separately.

- In the SPY call/put chart, green bars show call gamma and red bars show put gamma.
- Below spot, the chart shows heavier put-gamma concentration across the mid-to-high 660s and upper 670s.
- Above spot, there is visible call-gamma concentration building in the 680s through around 700.
- This is important because a net reading alone tells you the regime, but the split view shows where each side of the options chain is actually concentrated.
- For SPY, the chart makes it easier to see why $660–$670 matters on the downside and why $685–$700 matters on the upside.
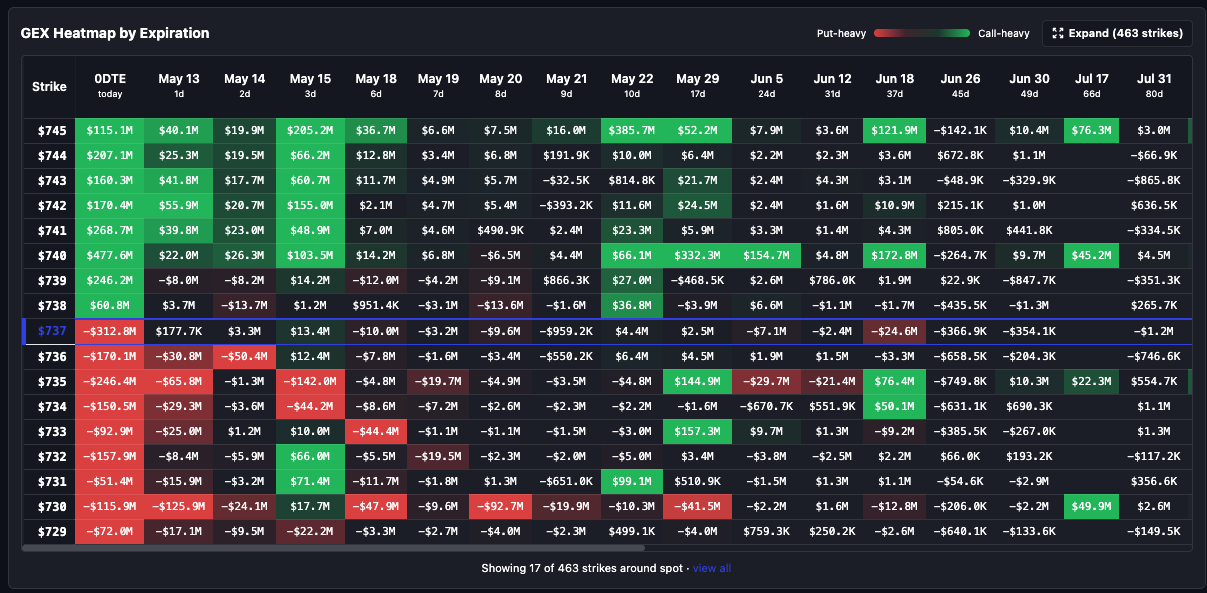
4. Filter the expirations that matter
Isolate 0DTE, the nearest weekly, or the next monthly expiration to see which maturities are driving the setup.

- In the SPY table example, one expiration is selected and spot is $677.52.
- In that filtered view, the call wall is $685 and the put wall is $670, which is tighter and more actionable than the broader full-chain picture.
- Net GEX is only -$122.7M in this slice, versus -$11.0B in the broader overview. That tells you immediately that the regime can look very different depending on which expirations you include.
- The table also helps you read individual strikes with precision:
- $685 is marked as the call wall and shows $179.2M net GEX with 17,093 call OI.
- $670 is marked as the put wall and shows -$131.8M net GEX with 12,410 put OI.
- Spot is sitting near $678, so these nearby strikes become the most relevant short-term reference points.
- The right-side signals reinforce that read by flagging $685 as a likely magnet and $670 as a downside volatility level.
- One useful detail here: Zero Gamma shows N/A in this filtered slice. That is not a bug; it is a reminder that not every expiration-specific view produces a clean gamma-flip level.
5. Validate with open interest
Use the Open Interest page to confirm whether the key gamma levels are backed by meaningful positioning.

- In the SPY open-interest screenshot, Total OI is 16.5M, Call OI is 5.4M, and Put OI is 11.1M, leaving Net OI at -5.7M.
- The page also shows PCR at 2.06, Max Pain at $680, and High OI at $660.
- That matters because it confirms the market is put-heavy overall, especially below spot.
- The OI profile also supports the idea that $660 is a real downside reference level, not just a number that happened to appear in the gamma chart once.
- When both GEX and OI point to the same strike region, that level usually deserves more attention than a level that only appears in one view.
6. Check intraday options flow context
Review Recent Options Flow to see whether live options activity is reinforcing or weakening the structure shown by the static chain.

- In the recent-flow screenshot, the panel is marked Bullish +$15.1M with high confidence.
- The visible prints are mostly SPY call sweeps clustered around the 678, 679, and 680 strikes.
- Those trades are useful because they line up closely with the nearby upside levels already identified in the gamma and table views.
- In other words, the live flow is not fighting the map; it is broadly consistent with it.
- This is the kind of cross-check you want: if gamma levels, open interest, and recent flow all point in a similar direction, the setup is usually more actionable than if they are conflicting.
7. Stress-test with the IV simulation
Use the IV Adjustment tool to see how much the map changes if implied volatility expands or contracts.
 Simulation for Gamma Exposure in InsiderFinance")
- In the screenshot, the simulation is set to -18% IV.
- This is best used as sensitivity analysis, not as a forecast.
- The practical question is not “what will IV do?” It is “if IV changes, do the important levels stay important?”
- A level that remains relevant after an IV adjustment is generally more robust than a level that disappears after a small change in assumptions.
- This is especially useful when you want to know whether a strong-looking strike is truly durable or just a byproduct of the current volatility setup.
As always, gamma exposure should be used as context, not as a standalone prediction tool.
What’s Genuinely Differentiating for Traders
Most “GEX pages” stop at a static strike histogram. The practical edge comes from connecting three layers:
- Gamma exposure by strike (where hedging pressure could concentrate)
- Open interest structure (what positioning underlies the map)
- Intraday flow context (what might be changing faster than published OI can reflect)
That combination directly addresses the known weaknesses of naive GEX approaches: OI lag and the need to incorporate intraday dynamics.
HIGH POTENTIAL TRADES SENT DIRECTLY TO YOUR INBOX
Add your email to receive our free daily newsletter. No spam, unsubscribe anytime.
FAQs
What Does Positive Gamma Exposure Mean?
Positive net gamma exposure is commonly interpreted as a regime where dealer hedging behavior tends to be counter-cyclical (sell rallies, buy dips), which can dampen volatility.
What Does Negative Gamma Exposure Mean?
Negative net gamma exposure is commonly interpreted as a regime where hedging tends to be pro-cyclical (buy rallies, sell dips), which can amplify moves. Academic work links short-gamma hedging demand to intraday momentum.
What Is the Gamma Flip?
Many platforms define a gamma flip point as the level where aggregate net gamma changes sign (positive to negative).
Why Does Gamma Exposure Focus So Much on Near-Term Expirations?
Because gamma is higher for at-the-money options and increases as expiration approaches. Official risk guidance also notes the difficulty of hedging ATM options as maturity collapses.
How Does 0DTE Affect Gamma Exposure Analysis?
0DTE concentrates high gamma sensitivity into the trading day; managing positions becomes more reactive as expiration approaches. Cboe’s materials also show 0DTE is a dominant share of SPX volume, making its effects harder to ignore in index-level structure.
Is Gamma Exposure a Predictive Signal?
Evidence supports that net gamma positioning can influence volatility and liquidity outcomes in models and that hedging demand can create intraday momentum, but GEX is best used as a framework/filter, not a mechanical “price must go here” signal.
Why Do Different Dashboards Show Different GEX Values?
Differences usually come from (a) which expirations are included, (b) whether and how intraday adjustments are modeled, and (c) assumptions about dealer vs customer positioning, none of which are perfectly observable from public chain data.