Explaining Options Flow and Dark Pool Prints

It all starts with the data.
Underpinning the industry-leading InsiderFinance platform is a proprietary algorithm that intelligently processes and filters the options flow and dark pool prints to increase your probability of success.
Unlike other order flow tools that use the same cookie-cutter data source and basic filtering, we start with the raw feed (i.e. 6M+ options contracts and 100M+ equity prints traded each day) and use proprietary processing and filtering, developed by a trained Wall Street quant, to only show you the trades that have the potential to be market-moving.
Our proprietary algorithm helps you trade with the flow, not against it, by only displaying high conviction options trades and dark pool prints to drastically reduce noise, making it easier to make decisions.
Combined with Heat Score, our proprietary indicator of how aggressively a trade was executed, you’ll have a clear picture of how bullish or bearish institutions are on a ticker, so you’re never trading against the large orders that drive price action.
Our algorithms do the heavy lifting for you so you can quickly identify market-moving trades without sorting through the noise.
While our focus is helping you save time through intelligent processing, we understand some traders would like to perform the analysis themselves.
That's why we made the full order flow available on the Ticker Research page, so you have the best of both worlds: market-moving data and the full trade population.
If you want to see more trades, you can use the Full Feed preset on the Ticker Research page to display all trades for a ticker above a premium threshold for both options flow and dark pool.
Options Flow
Options flow is an excellent leading indicator of short-term market direction, and InsiderFinance brings the trades that matter front and center with built-in intelligence.
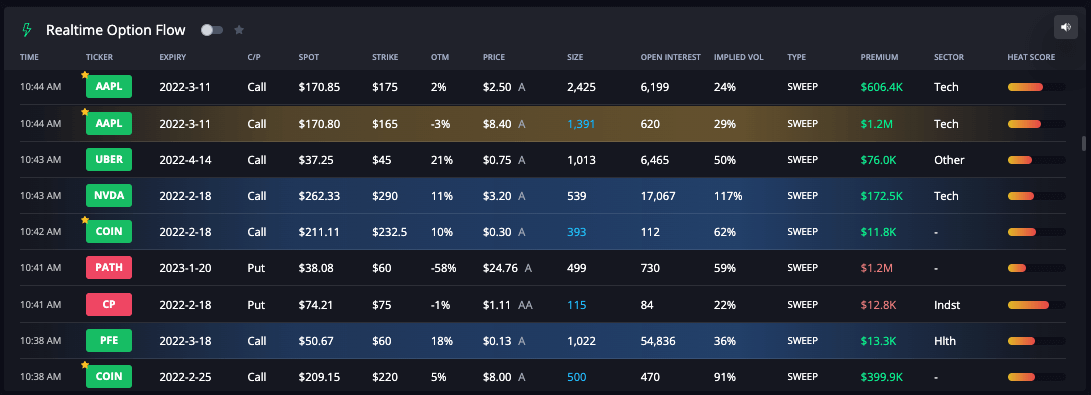
The options flow orders on the InsiderFinance dashboard are single-leg orders filled at or above ask/offer, meaning the dashboard only shows buy orders.
Institutional order flow for ask activity (i.e. the "purchasing side") is a very powerful leading indicator, and our proprietary filtering algorithm only shows orders where the trader’s intent is clear.
In other words, call orders imply bullish intent, and put orders imply bearish intent.
There’s no way to tell if an order executed at mid-market was bought or sold, so InsiderFinance does not display orders executed at mid.
InsiderFinance doesn’t currently show orders filled at or below bid, but those orders will be added soon.
Below are some key definitions to help you interpret the flow:
Order Type
InsiderFinance InsiderFinance uses a proprietary method to identify trade type and displays them in the dashboard in the Type column as shown below.

A block trade is a large, privately negotiated order between two parties. They are often done outside of the open markets (i.e. not through public auctions) as their size can cause large fluctuations in volume.
Sweep trades indicate urgency in execution. The buyer prioritizes speed to fill over the lowest possible price.
A buyer uses a sweep trade when he or she wants to enter a position as fast as possible, presumably ahead of a large anticipated movement in the stock’s underlying price expected to happen very soon.
- Split: sweep-to-fill orders filled on the same exchange
- Sweep: sweep-to-fill orders filled across multiple exchanges
OTM (Out-of-the-Money)
OTM % represents how far the strike price is above (for calls) or below (for puts) the stock's market price at the time of purchase.
OTM % serves as a good indicator of how much Wall Street is expecting the underlying stock price to move.
High OTM % trades imply an expectation for big price swings in the underlying stock, often leading to even larger increases in the option value.
InsiderFinance makes it easy to identify which options contracts are in the money or out of the money with the OTM % (Out of the Money Percent) fields in the dashboard, as shown below:

Top Positions
A contract where the contract size is greater than open interest on its own. The size text for these orders is highlighted in blue.

"Golden Sweep"
A sweep over $1M in premium that's also a top position. These characteristics imply urgency in execution, and golden sweeps typically determine short-term market direction.

Unusual Options Activity
A contract greater than or equal to 10% OTM with less than 35 days to expiry.

Order Side
The A means the trade was executed at Ask (i.e., offer or buy-side), and the AA means the trade was executed Above Ask.

If a trade was executed Above Ask, the buyer was very bullish on the trade and willing to pay extra to ensure he/she could enter it.
You could also view this as "aggressively" entering the position.
Heat Score
Our proprietary indicator of how aggressively a trade was executed (see our Heat Score article for additional detail).
You can sort for this to put aggressive trades front and center!

HIGH POTENTIAL TRADES SENT DIRECTLY TO YOUR INBOX
Add your email to receive our free daily newsletter. No spam, unsubscribe anytime.
Filtering the Flow
The InsiderFinance Dashboard can be filtered to fit your trade style, which means you see only the results that matter, not an overwhelming list of useless trades or raw data.
Actionable Presets

Simply click an Actionable Preset that fits your trade style to take the guesswork out of finding high-potential setups:
Unusual
- Unusual Options Activity represents individual options contracts that expire within 35 days and are at least 10% out of the money.
- Unusual trades imply that Wall Street is expecting big price swings in short order.
Sweeps
- Sweeps are orders Wall Street tries to disguise by executing across multiple exchanges.
- Sweep trades indicate the highest urgency in fulfillment.
Momentum
- Momentum is our proprietary relative volume indicator if you like to trade volume.
Moonshot
- Low-priced contracts with high potential for big price swings.
You can also take these a step further and filter the command center for Ticker Flow 95%+.
Tickers with close to 100% bullish or bearish flows mean smart money agrees on whether they think the price will go up or down.
Command Center
Looking for more tailored filtering? Our Command Center allows you to filter the dashboard any way you choose.
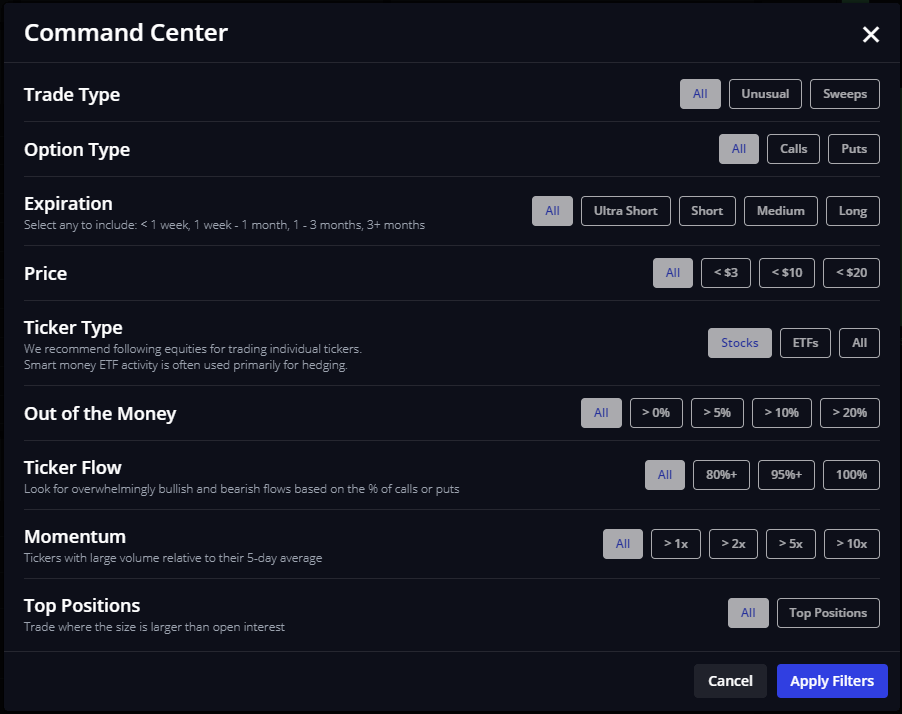
Your most recent setting will be saved in our database, but you can always reset it by clicking Equities (the “Default” filter).
Follow Tickers and Flows
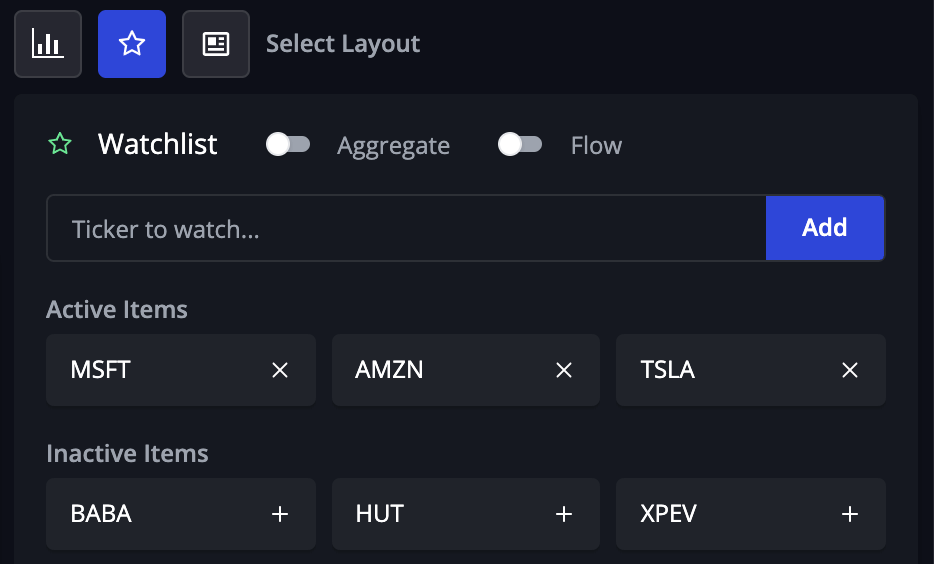
It’s easy to follow your favorite tickers on the InsiderFinance Dashboard with the Watchlist.
Add any ticker you want to follow to your custom watchlist and select whether you want to filter the Smart Market Insight by Ticker, Real-Time Option Flow, or both.
Any new trades added to the dashboard from tickers on your watchlist are easily identified with stars.
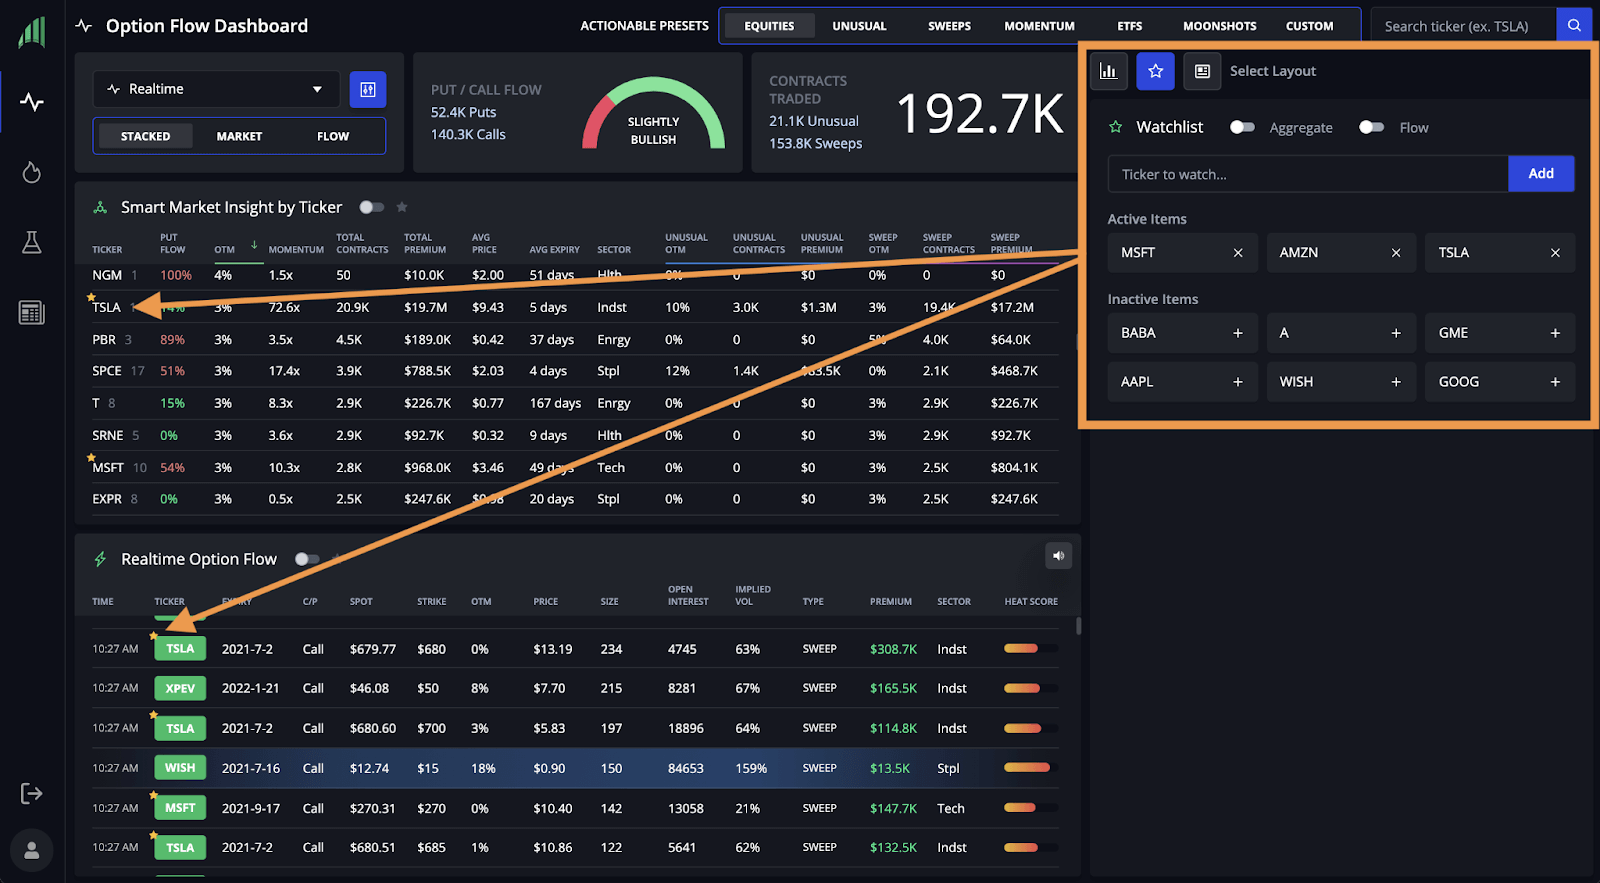
If you only want to hear sound notifications for tickers on your watchlist, simply filter the flow for starred tickers.

Dark Pool Prints
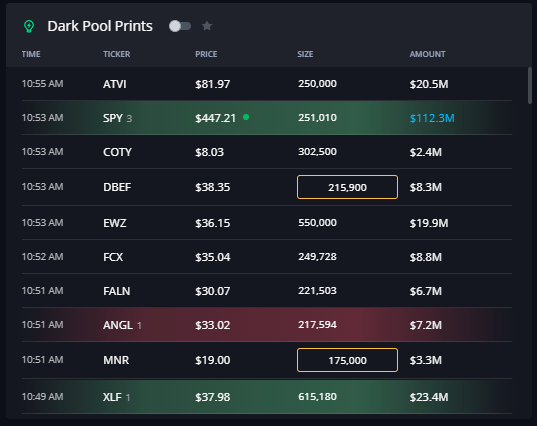
Dark pool trades, or prints, are equity block trades executed over-the-counter (OTC) through a private exchange only available to institutional investors.
These private exchanges (also called Alternative Trading Systems) are known as “dark pools” due to their complete lack of transparency.
Understanding dark pool prints is critical for identifying upcoming market movements, trend changes, and support and resistance levels.
Dark pool prints are a leading indicator of upcoming market movements.
This is especially true for major indexes like SPY. Historically, SPY dark pool prints have proved to be a powerful leading indicator of large upcoming market movements.
A pattern of multiple large trades with bullish characteristics has predicted very large bullish swings in the overall market, and the opposite pattern has predicted major downturns.
Dark pool prints can signal the beginning of a trend or a change in trend.
Dark pool prints have proved just as powerful at indicating the beginning of a trend or a reversal for any ticker.
A pattern of multiple large trades with bullish characteristics on a ticker with otherwise bearish characteristics can indicate a change in trend, or the same pattern can indicate the beginning of a trend on a ticker otherwise trading sideways.
Dark pool print accumulation can identify support and resistance levels.
Tracking the price level that dark pool prints are trading over time helps identify support and resistance levels.
If a ticker is trading down, identifying large dark pool print accumulations below the current price will uncover support levels where a reversal may occur.
The more volume that was transacted at that price, the stronger the support level is likely to be. The same is true for large accumulations above the current price.
The price with the most volume accumulated can signal the resistance level at which the ticker may consolidate and reverse down.
InsiderFinance brings the dark pool trades that matter front and center with built-in intelligence. Below are some key definitions to help you interpret the prints:
Late Buys and Sells
InsiderFinance highlights dark pool prints reported late. These are the trades that institutions make an extra effort to hide.
Dark pool prints traded below the open
Dark pool prints traded below the open of the current trade day are highlighted in green and imply bullish sentiment, which means an institution bought the stock before it increased in price the following day.
Late Buy -> Bullish Sentiment

Dark pool prints traded above the open
Dark pool prints traded above the open of the current trade day are highlighted in red and imply bearish sentiment, which means an institution sold the stock before its price decreased the following day.
Late Sell -> Bearish Sentiment

InsiderFinance provides added context for whether late trades on major indexes (SPY, QQQ, IWM, and DIA) were made with bullish sentiment or bearish sentiment.
We do this by showing red or green dots next to major index trades to identify whether the current spot price when the trade was reported is above or below where the index is currently trading for the day.
Late Buy + Green Dot → Bull Trend

Late Buy + Red Dot → Possible Bear Reversal

Late Sell + Red Dot → Bear Trend

Late Sell + Green Dot → Possible Bull Reversal

Unusually High Volume Orders
Dark pool prints where the block size is at or above 30% of the stock’s daily average volume can be particularly interesting and significant.
InsiderFinance makes these trades easy to spot with a gold box around the order size.

Large Premium Orders
Dark pool prints with a notional value above $50 million are also worth watching.
InsiderFinance makes these trades easy to spot with blue text on the notional amount.

Tips for Trading with Order Flow
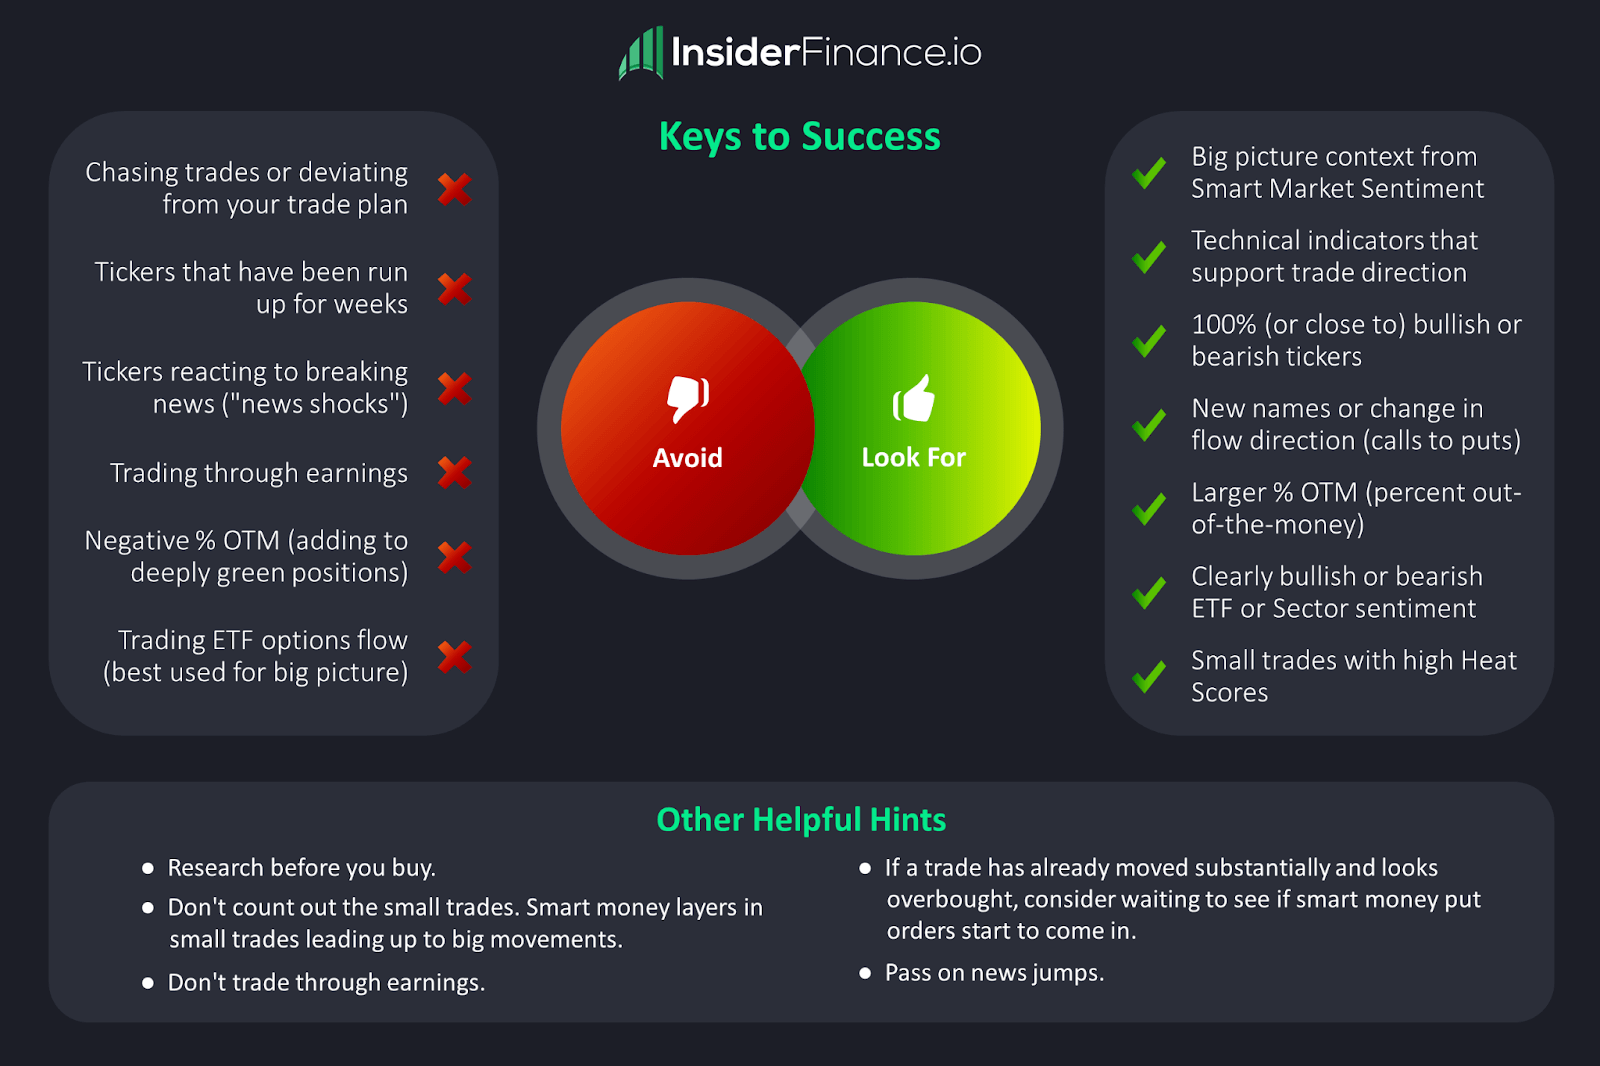
Read our tips for trading alongside smart money, or see the summary below.
HIGH POTENTIAL TRADES SENT DIRECTLY TO YOUR INBOX
Add your email to receive our free daily newsletter. No spam, unsubscribe anytime.


