3 Steps to Trade
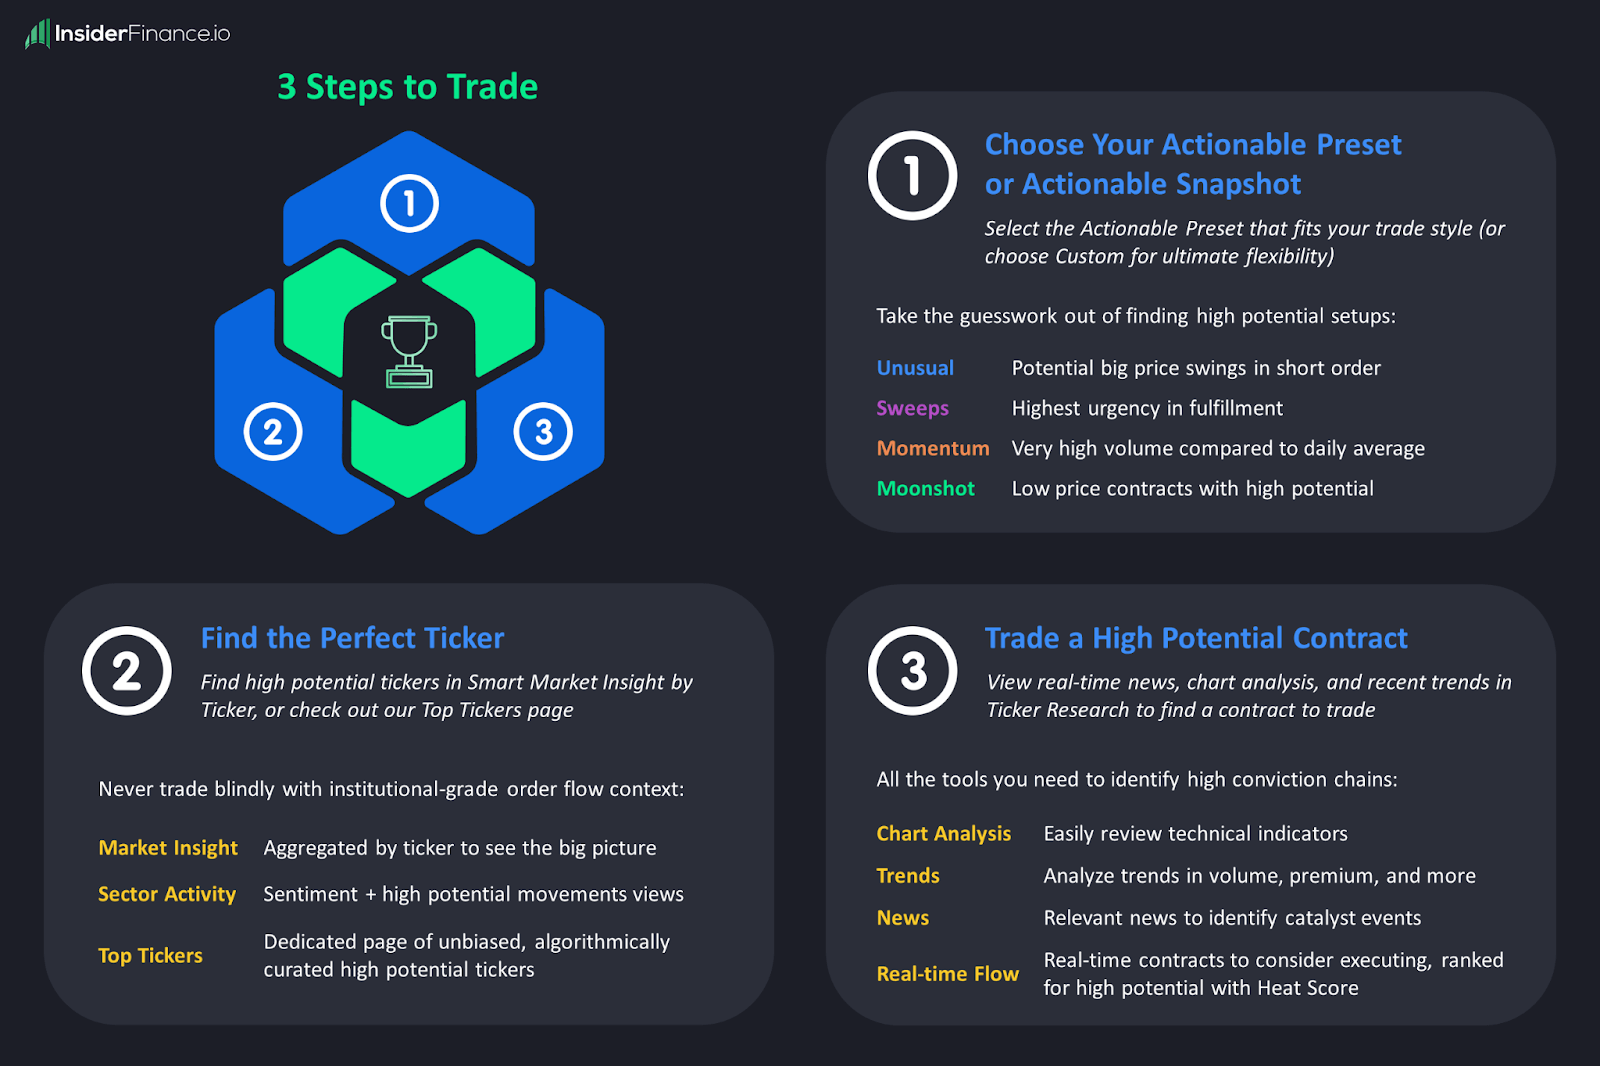
1) Filter the Dashboard to Fit Your Trade Style
Filter the dashboard for trades that fit your style (or try one of our Actionable Presets).

Unusual
- Unusual Options Activity represents individual options contracts that expire within 35 days and are at least 10% out of the money.
- Unusual options trades imply that Wall Street expects big price swings in short order.
Sweeps
- Sweeps are options orders Wall Street tries to disguise by executing across multiple exchanges.
- Sweep trades indicate the highest urgency in fulfillment.
Momentum
- Momentum is our proprietary relative volume indicator if you like to trade options volume.
Moonshot
- Low-priced options contracts with high potential for big price swings.
2) Find a High-Potential Ticker
Find the right high-potential tickers in the Smart Market Insight by Ticker, or check out the Top Tickers page for an algorithmically curated list of high-potential tickers to start researching.
Sort by any column to find the tickers that fit your style the fastest, or use our suggested sorting from the Actionable Preset.

Understand the overall sector sentiment for the ticker. This can be useful to ensure that you aren't trading "against the current."
For example, the tech sector is very bullish in the image below, so picking a tech ticker could have a better potential to go up ("all ships rise with the tide," as the saying goes).

HIGH POTENTIAL TRADES SENT DIRECTLY TO YOUR INBOX
Add your email to receive our free daily newsletter. No spam, unsubscribe anytime.
3) Find a High-Potential Options Contract to Trade
Hone in on the right contract on the Ticker Research page.

View the News to understand the general sentiment or any catalyst events.

Pull up the InsiderFinance Technical Analysis System to make sure you like the technicals.

Analyze recent trends such as volume, premium, or expiry distribution.


Assuming your research has gone well, use the real-time flow to find a contract to consider executing.
You can also sort the options orders by Heat Score, our proprietary algorithm uses an unbiased, data-driven approach to identify and rank Wall Street’s highest conviction trades.

Trade Entry Checklist
Generally, the more data points supporting a trade idea, the higher the probability of success.
Although our tools can be used for any trading strategy, we'll highlight a simple strategy we've used repeatedly with success.
Like institutions and hedge funds, we only trade ETFs as hedges against the market.
When looking for trade ideas on individual tickers, we look for bullish trades with the most support behind them.
This is the "checklist" we typically like to follow before entering a position:
Repeated calls and close to 0% put flow
- Close to 0% put flow means that Wall Street agrees that the price will rise
Recent dark pool activity
- Green highlights or gold boxes are ideal
Strong technicals
- 4-point confirmation on the 1-hour chart and ideally also the 4-hour chart
Positive news sentiment
- Mostly positive sentiment and no major red flags in recent headlines
Bullish sector activity
- Bullish sector sentiment helps you avoid trading “against the current”
High Heat Scores
- Trades were made with high conviction
For strong technicals, we typically like to see bullish signals on both the 1-hour chart and 4-hour chart. A bullish signal on the daily chart is a great bonus.
If we don't see bullish signals on both, we typically create an alert on the chart that hasn't turned bullish yet and enter when it does.
HIGH POTENTIAL TRADES SENT DIRECTLY TO YOUR INBOX
Add your email to receive our free daily newsletter. No spam, unsubscribe anytime.